🌍 Public
International Map using d3.js
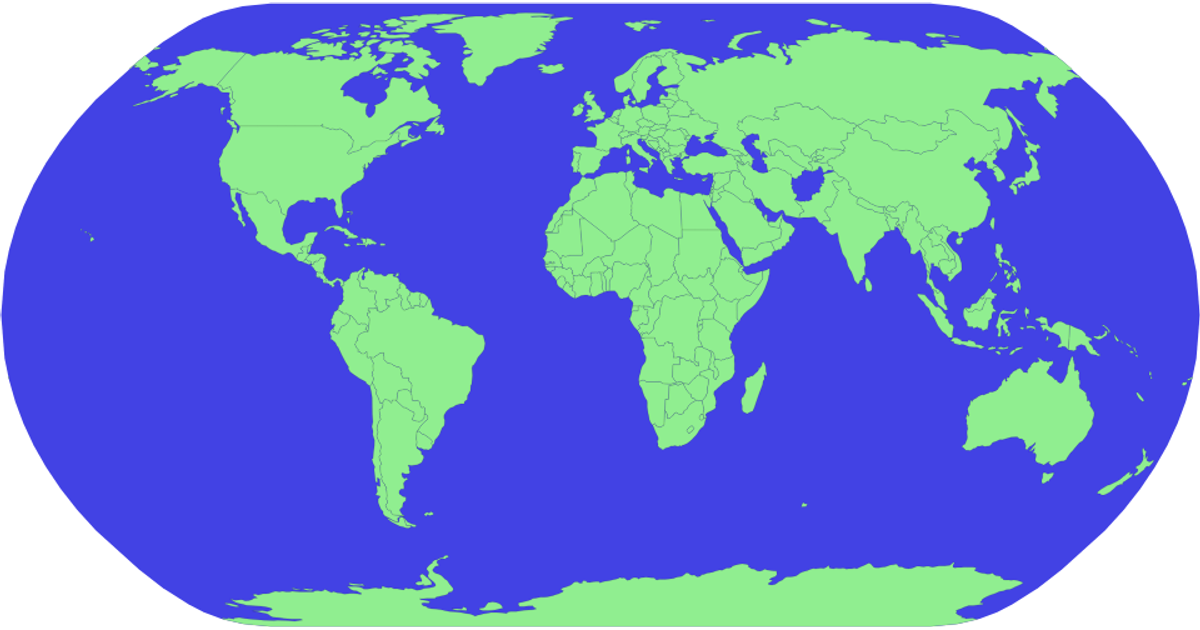
This example displays a world map using a natural Earth projection, with countries filled in teal and outlined in red. The visualization reads country boundary data from the world-atlas TopoJSON dataset hosted on jsDelivr. It uses d3.js v5 functions such as `geoNaturalEarth1` for projection, `geoPath` for generating SVG paths, and the TopoJSON `feature` function to extract country geometries from the topology. The map is rendered as an SVG inside an HTML page, with a light blue sphere background and hidden page margins.
AI-generated descriptionMIT Licensed




Comments
Sign in to join the discussion.