🌍 Public
Activity6 Task4
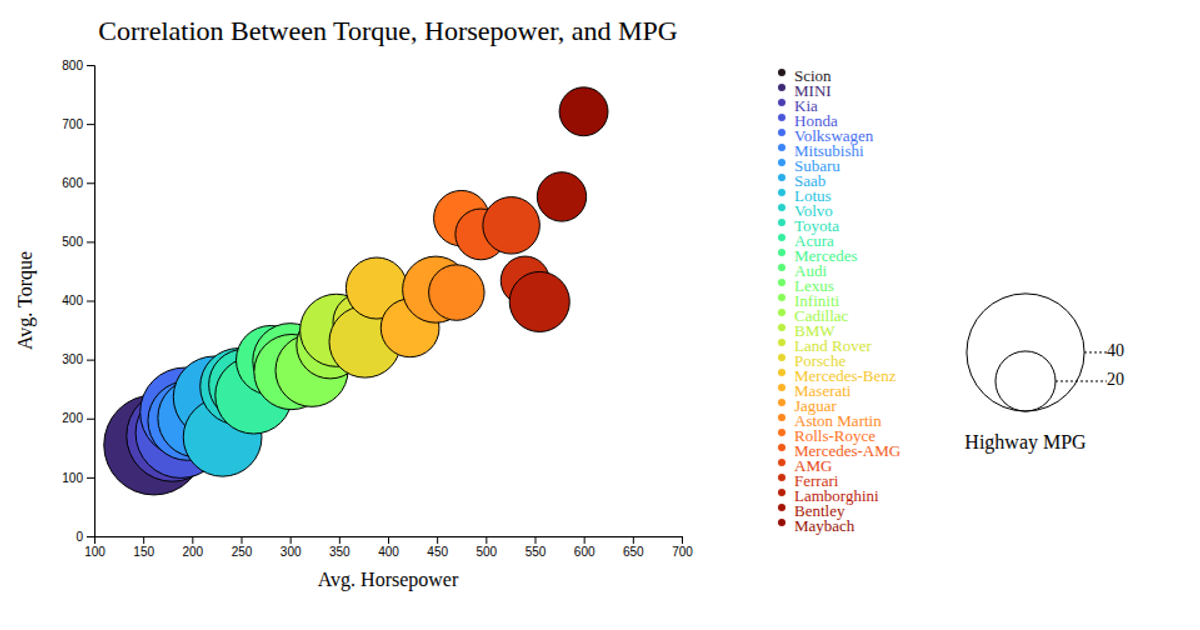
This bubble chart visualizes the correlation between average horsepower, torque, and highway MPG for various car makes. Each circle, rendered with SVG and D3.js, positions vehicles by their performance metrics, while bubble size encodes fuel efficiency and color distinguishes the manufacturer. The visualization includes an interactive tooltip that displays the car make on hover, and a legend for interpreting the MPG scale. Data is loaded from a local CSV file using `d3.csv`.
AI-generated descriptionMIT Licensed



Comments
Sign in to join the discussion.