🌍 Public
Fork of Outlier 2024 Unconf
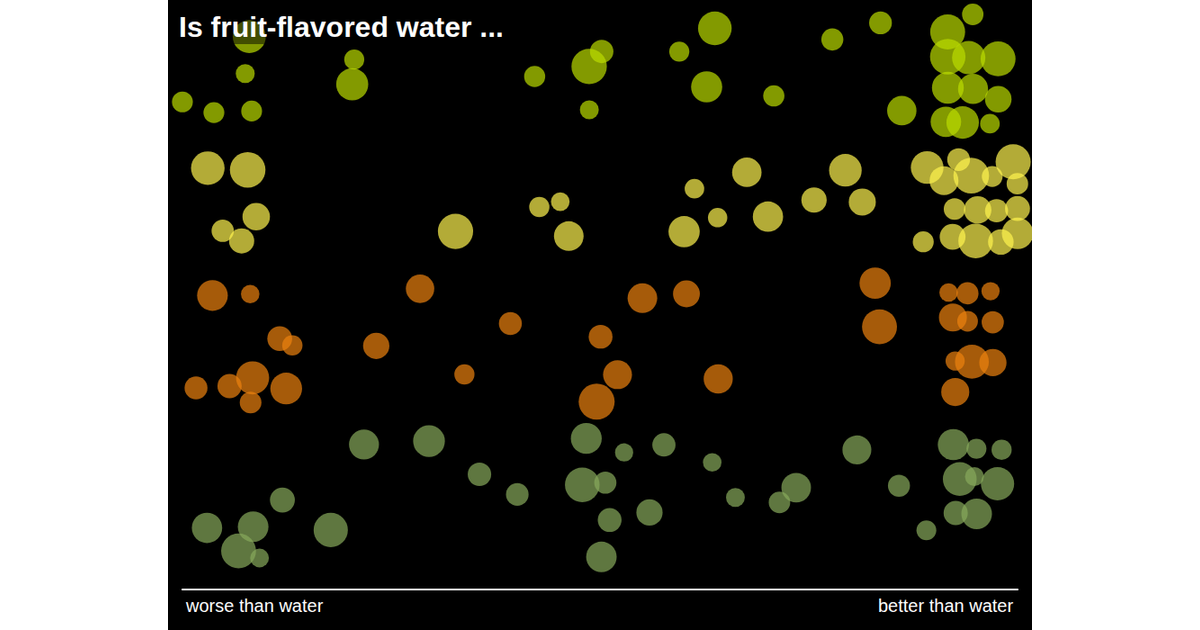
A scatterplot of fruit-flavored water ratings maps each drink to an X axis of "worse than water" to "better than water" against a Y axis of flavor quality. Orange, lemon, lime, and cucumber groups are rendered as colored circles via Svelte components and SVG, using D3's `scaleLinear` and `extent` for positioning. Hovering a circle reveals its group label.
AI-generated descriptionMIT Licensed






Comments
Sign in to join the discussion.