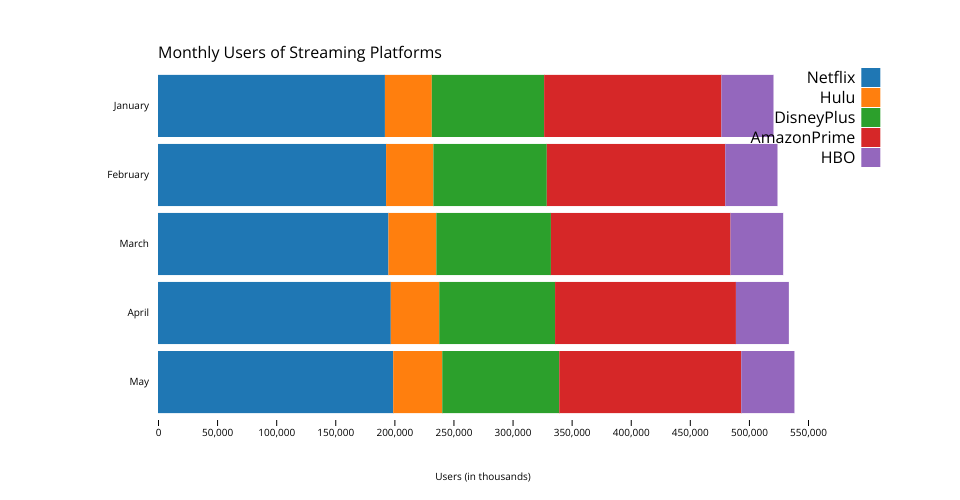
Each row represents a month, and the columns represent the number of users of each platform in that month (in thousands).
Visualization
The visualization code is contained in the index.html file, and the styles are defined in the styles.css file.
To view the visualization, open index.html in your web browser.
MIT Licensed