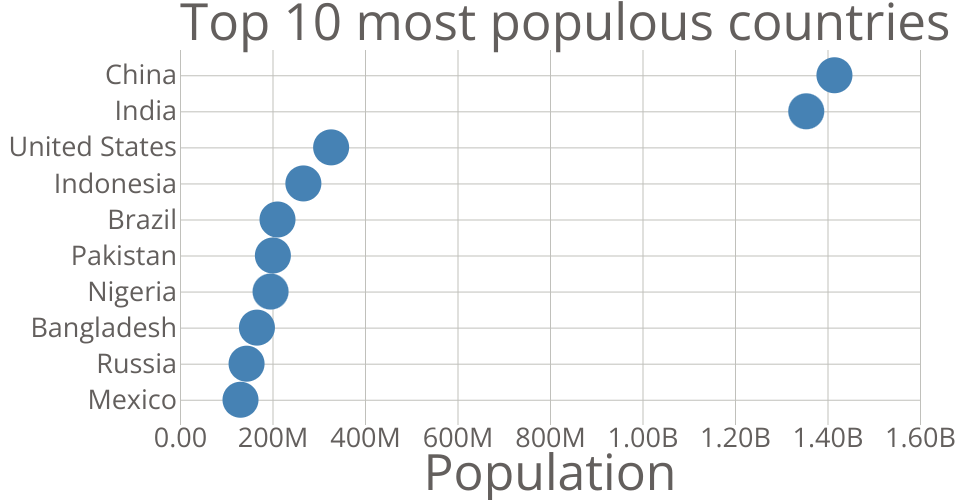
This bar chart shows population of the most populous countries. The data comes from the year 2018 estimate in World Population Prospects 2017.
MIT Licensed
This bar chart shows population of the most populous countries. The data comes from the year 2018 estimate in World Population Prospects 2017.