Pie Chart with Tooltips and Legend
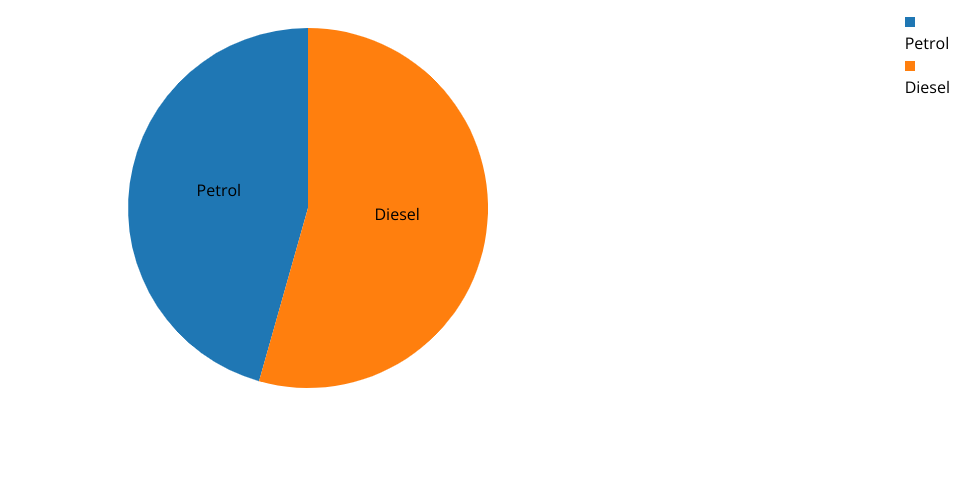
This project showcases a pie chart visualization with tooltips and a dynamic legend using D3.js library.
Features:
Data Loading: Data is loaded from a CSV file (
car_dataset.csv) using D3'sd3.csvmethod.Pie Chart: A pie chart is rendered using SVG elements to visualize the distribution of fuel types present in the dataset.
Interactive Tooltip: Mouseover events on each segment of the pie chart display a tooltip showing the fuel type and its count.
Dynamic Legend: A legend is dynamically generated based on the unique fuel types present in the dataset, providing visual cues for the colors used in the pie chart.
Color Encoding: Fuel types are encoded with distinct colors using D3's
scaleOrdinalscale and a categorical color scheme.Responsive Design: The visualization adjusts to different screen sizes, maintaining its integrity and readability.
External Library: D3.js library is included via CDN (
https://d3js.org/d3.v7.min.js).Styling: CSS styling is applied to enhance the appearance of the tooltip, providing a clean and intuitive user experience.
Modularity: The code is structured using functions and method chaining for improved readability and maintainability.
Accessibility: The visualization is designed to be accessible, with tooltips providing additional information for users with disabilities.