Scatter Plot Visualization
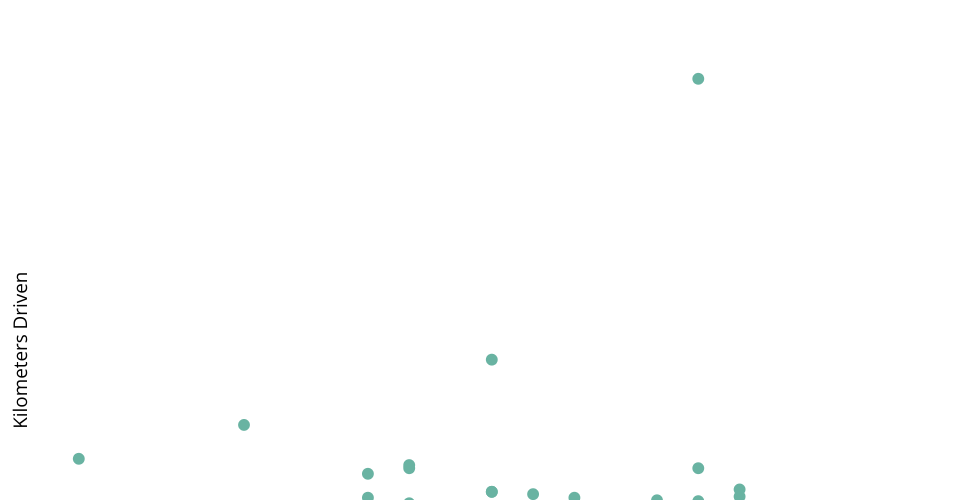
This project demonstrates a simple scatter plot visualization using D3.js library.
Features:
Data Loading: Data is loaded from a CSV file (
car_dataset.csv) using D3'sd3.csvmethod.Scalable Vector Graphics (SVG): The scatter plot is rendered using SVG elements, allowing for scalable and responsive visualization.
Interactive Tooltip: Hovering over data points displays a tooltip showing the year and kilometers driven of the corresponding car.
Axis Labels: X and Y axis labels are added to denote the data dimensions.
Dynamic Scales: Scales for both X and Y axes are dynamically calculated based on the loaded data.
Data Binding: Data points are bound to circles, making it easy to update the visualization with new data.
Styling: CSS styling is applied to the tooltip for better readability and aesthetics.
External Library: D3.js library is included via CDN (
https://d3js.org/d3.v7.min.js).Responsive Design: The visualization adjusts to different screen sizes using the
viewBoxattribute of the SVG element.Accessibility: The visualization is designed to be accessible, with tooltips providing additional information for users with disabilities.