D3.js Line Chart
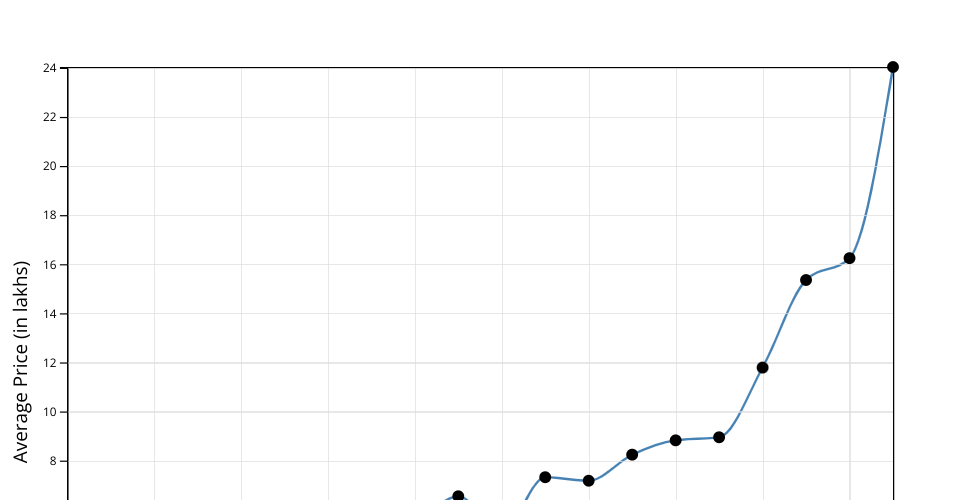
This project presents a line chart visualization using D3.js library to depict the average price of cars over the years.
Features:
Data Loading: Data is loaded from a CSV file (
car_dataset.csv) using D3'sd3.csvmethod.Line Chart: A line chart is rendered using SVG elements to illustrate the trend of average car prices over the years.
Data Transformation: The data is processed to convert necessary fields to numeric values and sorted by year for proper visualization.
Scalable Vector Graphics (SVG): The visualization is implemented using SVG, providing scalability and responsiveness.
Axes: Both X and Y axes are drawn to provide context to the data, with appropriate labels denoting the year and average price.
Gridlines: Gridlines are added to enhance readability and aid in interpreting the chart accurately.
Smoothing Curve: The line chart uses a monotone X-curve to smoothen the visual representation of data points.
Interactive Tooltip: Hovering over data points displays a tooltip showing the year and corresponding average price of cars.
External Library: D3.js library is included via CDN (
https://d3js.org/d3.v7.min.js).Styling: CSS styling is applied to elements, including the line, gridlines, and tooltip, for improved aesthetics and clarity.