Search
Pricing
Resources
Log in
surikmeetr
@surikmeetr
Public vizzes
Starred vizzes
Public vizzes
Sort by
Most recent
Coronavirus Deaths Over Time by Country With Voronoi Overlay and tooltips
surikmeetr
May 05, 2021
Fork of Coronavirus Deaths Over Time by Country With Voronoi Overlay
1
Fork
surikmeetr
May 05, 2021
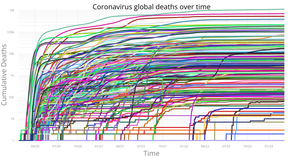
Coronav deaths over time by country voronoi overlay
surikmeetr
Apr 30, 2021
Coronav deaths over time by country
2
Forks
surikmeetr
Apr 29, 2021
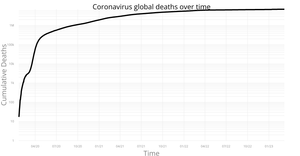
Coronav deaths over time by country (linear)
surikmeetr
Apr 29, 2021
React + d3 axes + log scale + labels
1
Fork
surikmeetr
Apr 27, 2021
React + d3 axes + log scale
1
Fork
surikmeetr
Apr 24, 2021
React + d3 axes X and Y
1
Fork
surikmeetr
Apr 24, 2021
React + d3 axes
1
Fork
surikmeetr
Apr 24, 2021
Coronav deaths line chart 2 margin convention

1
Fork
surikmeetr
Apr 20, 2021
Rapporto pcr/positivi per regione - line chart
surikmeetr
Apr 19, 2021
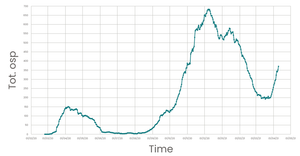
Tamponi sardegna: Rapporto pcr/positivi - line chart 7 mesi
1
Fork
surikmeetr
Apr 19, 2021
Coronav deaths line chart
1
Fork
surikmeetr
Apr 17, 2021
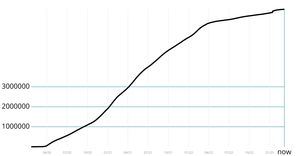
Summarized deaths coronav
surikmeetr
Apr 16, 2021
Parsing CSV data with D3
1
Fork
surikmeetr
Apr 13, 2021
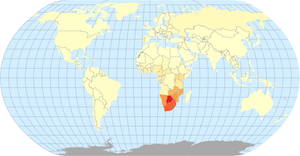
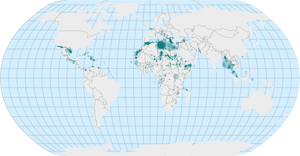
HIV/AIDS choropleth map
surikmeetr
Apr 12, 2021
Line chart temp
1
Fork
surikmeetr
Apr 10, 2021
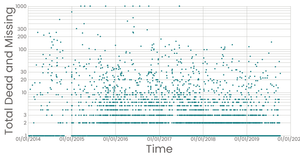
Missing migrants log scale
surikmeetr
Mar 25, 2021
Missing migrants with brushing
surikmeetr
Mar 25, 2021
Missing migrants multiple view
1
Fork
surikmeetr
Mar 23, 2021
Missing migrants p1
surikmeetr
Mar 22, 2021
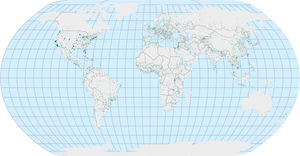
Missing migrants on map
2
Forks
surikmeetr
Mar 19, 2021
Fork of loading and parsing csv data part 2 await/async - ep 13
1
Fork
surikmeetr
Mar 17, 2021
Point size
1
Fork
surikmeetr
Mar 16, 2021
Points on a map
1
Fork
surikmeetr
Mar 15, 2021
interactive color legend
surikmeetr
Mar 15, 2021
Scatterplot with color and legend
1
Fork
surikmeetr
Mar 15, 2021
Scatterplot with color
1
Fork
surikmeetr
Mar 13, 2021
Polished Scatterplot with menus
1
Fork
surikmeetr
Mar 13, 2021
Scatterplot with menus
1
Fork
surikmeetr
Mar 12, 2021
React starter - menu
surikmeetr
Mar 12, 2021
React starter
1
Fork
surikmeetr
Mar 12, 2021
World map less. 29
1
Fork
surikmeetr
Mar 11, 2021
Temperature line chart
2
Forks
surikmeetr
Mar 11, 2021
Temperature scatterplot chart
2
Forks
surikmeetr
Mar 11, 2021
React start practice 1
surikmeetr
Mar 10, 2021
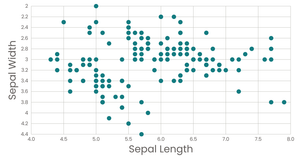
Scatter plot iris dataset
2
Forks
surikmeetr
Mar 09, 2021
Stylized bar chart
1
Fork
surikmeetr
Mar 09, 2021
Refactor bar chart
1
Fork
surikmeetr
Mar 09, 2021
Axes with React & D3
1
Fork
surikmeetr
Mar 08, 2021
Margin convention
1
Fork
surikmeetr
Mar 08, 2021
Pathetic bar chart fork
1
Fork
surikmeetr
Mar 05, 2021
Display css colors with react using D3 pie
1
Fork
surikmeetr
Mar 05, 2021
Display css colors with react
1
Fork
surikmeetr
Mar 05, 2021
test Vega-Lite API 2
surikmeetr
Mar 05, 2021
Fork of Vega-Lite API Template
1
Fork
surikmeetr
Mar 05, 2021
Load data with D3 & React
1
Fork
surikmeetr
Mar 04, 2021
Mouse follower
1
Fork
surikmeetr
Mar 03, 2021
loading and parsing csv data - ep 13
1
Fork
surikmeetr
Mar 03, 2021
Smiley face with react comp part 6
1
Fork
surikmeetr
Mar 03, 2021
Smiley face with react comp
1
Fork
surikmeetr
Mar 02, 2021
Tweaked smiley face
1
Star
surikmeetr
Mar 01, 2021
Smiley face pt. 1
2
Forks
surikmeetr
Mar 01, 2021