Covid pandemic in Italy
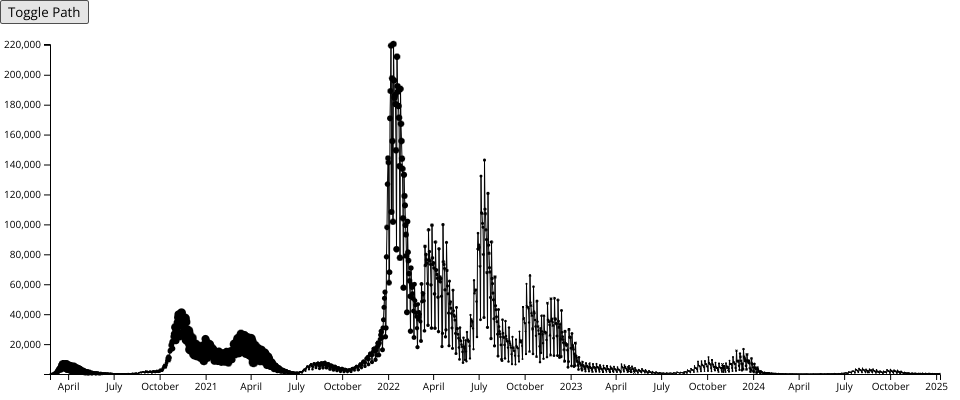
This scatterplot shows the time series of daily new cases of Covid in Italy.
- x-axis exploits
scaleTime - the radius of points is proportional (i.e.,
scaleLinear) to the amount of patients in intensive care on a daily basis - use the button in the top-left corner to toggle the path
- Data source (continuously updated)
MIT Licensed