Export Image
Export Code

Fork of Scatter Plot with Menus

sumitradevipolina

0 views in last 90 days
Last edited Mar 12, 2022
Created on Mar 10, 2022

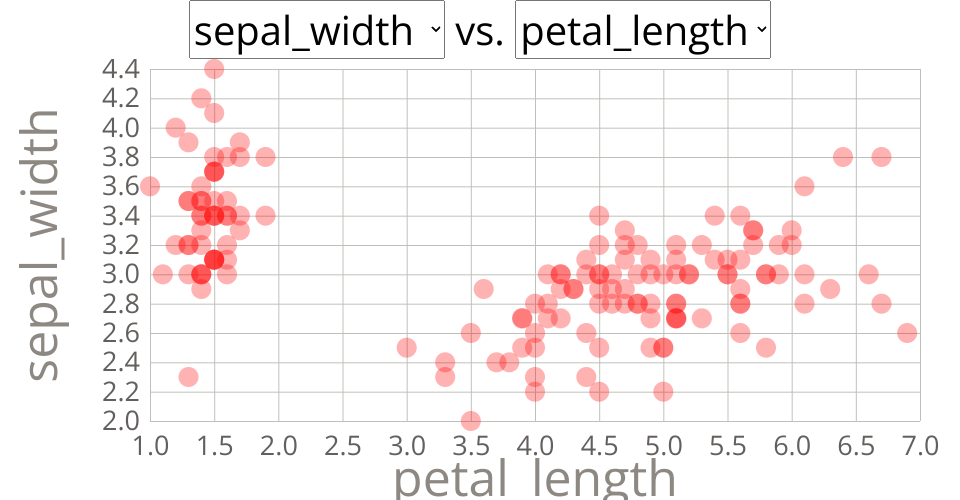
This scatter plot shows data aboutiris data. The user can select which columns map to X and Y using dropdown menus.

MIT Licensed