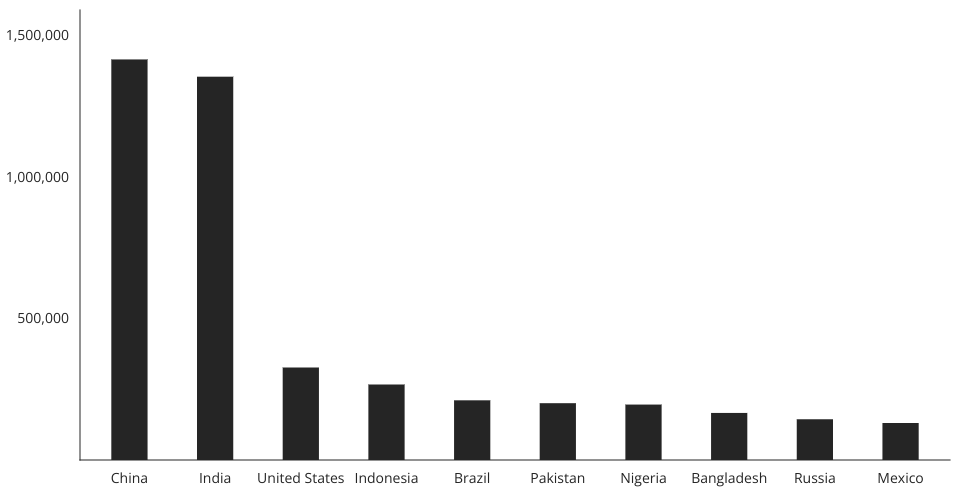
This example shows how to load data from a CSV file using React hooks and visualize the result using Victory Charts. Inspired by this Victory example from Swizec Teller in React for Data Visualization.
MIT Licensed
This example shows how to load data from a CSV file using React hooks and visualize the result using Victory Charts. Inspired by this Victory example from Swizec Teller in React for Data Visualization.