Unemployment Rate Visualization
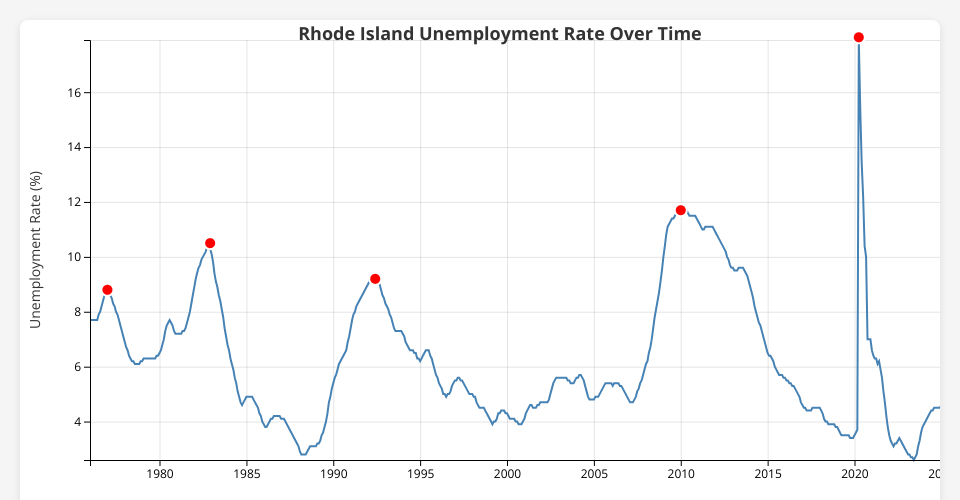
This project visualizes the unemployment rate in Rhode Island over time using D3.js and React.
Features
- Interactive line chart showing unemployment trends
- Red dots marking significant spikes in unemployment:
- Spike before 1980
- Spike between 1980 and 1985
- Spike between 1990 and 1995
- Spike around 2010
- Major spike in 2020
Data Source
The data is sourced from Federal Reserve Economic Data (FRED) and represents monthly unemployment rates in Rhode Island.
Implementation
- Uses D3.js for data visualization
- Built with React for the UI
- Responsive SVG chart with grid lines and axis labels
MIT Licensed