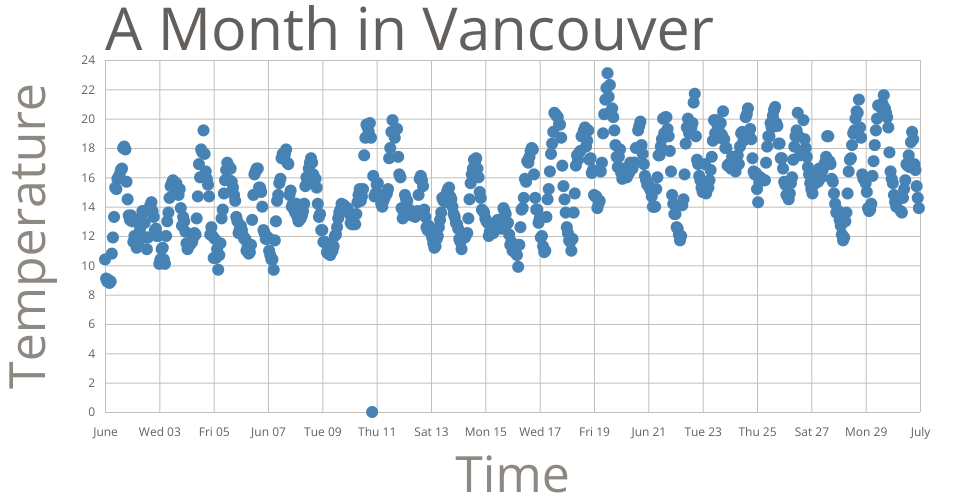
This scatter plot shows one week of temperature at hourly intervals (in degrees Celcius) in Vancouver. Source: https://climate.weather.gc.ca/
MIT Licensed
This scatter plot shows one week of temperature at hourly intervals (in degrees Celcius) in Vancouver. Source: https://climate.weather.gc.ca/