Company Financial Data Visualization
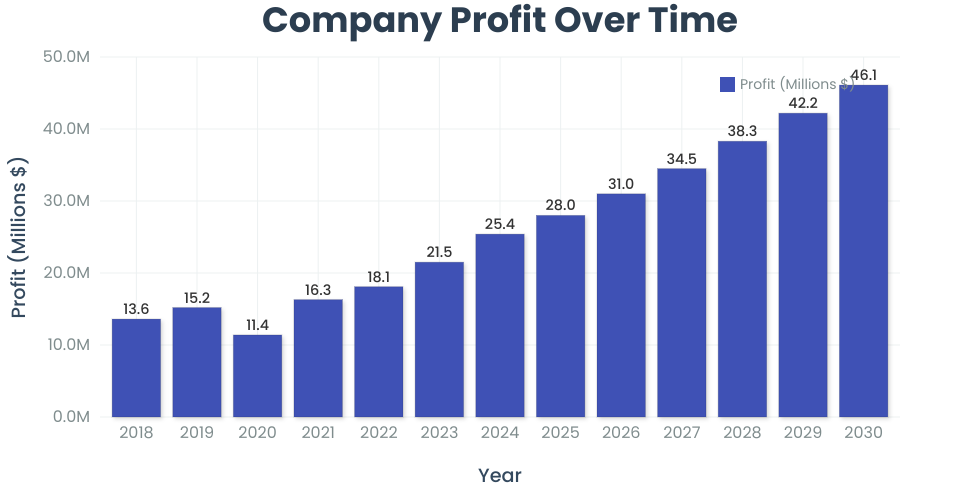
This project visualizes company financial data from 2018-2030 using a bar chart that shows profit over time.
Data
The visualization shows:
- Year
- Revenue (in millions $)
- Expenses (in millions $)
- Profit (in millions $)
- Employees
Features
- Responsive bar chart showing profit over time
- Interactive hover effects with drop shadows
- Clean, modern styling with Poppins font
- Properly formatted axes with grid lines
- Data labels on each bar
- Legend for clarity
How to Run
Open index.html in a web browser to view the
visualization.
Implementation Details
- Built with React and D3.js
- Uses CSS for styling
- Responsive design with proper margins
MIT Licensed