Company Financials Scatter Plot
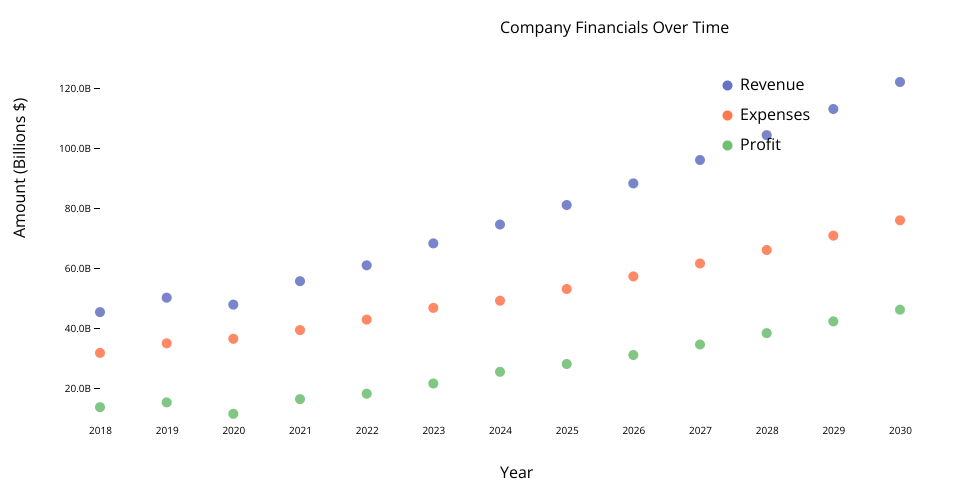
This visualization shows a company's financial data (Revenue, Expenses, and Profit) from 2018 to 2030 using a scatter plot.
Features
- Scatter plot visualization with three data series (Revenue, Expenses, Profit).
- Interactive tooltips on hover to display detailed data for each point.
- Clean, modern styling with a clear legend.
- Built with React for component-based architecture and D3.js for scales and axis generation.
- Refactored into modular components for better readability and maintenance.
Data Source
The data is statically included in the application source code and represents fictional company financial projections.
Implementation
Built with React and D3.js, using functional components and hooks for state management and side effects.
MIT Licensed