Car Performance Pie Chart
This project visualizes vehicle horsepower distribution using D3.js.
Files
index.html→ Main HTML structurestyle.css→ Styling for layout and visualsindex.js→ D3 logic to render the pie chartCarPerformance.csv→ Dataset hosted on GitHub
Data Source
CSV hosted at:
CarPerformance.csv (GitHub Raw)
How to Run
- Open index.html in your browser, or
- Fork on VizHub, ensuring CSV URL points to GitHub Raw.
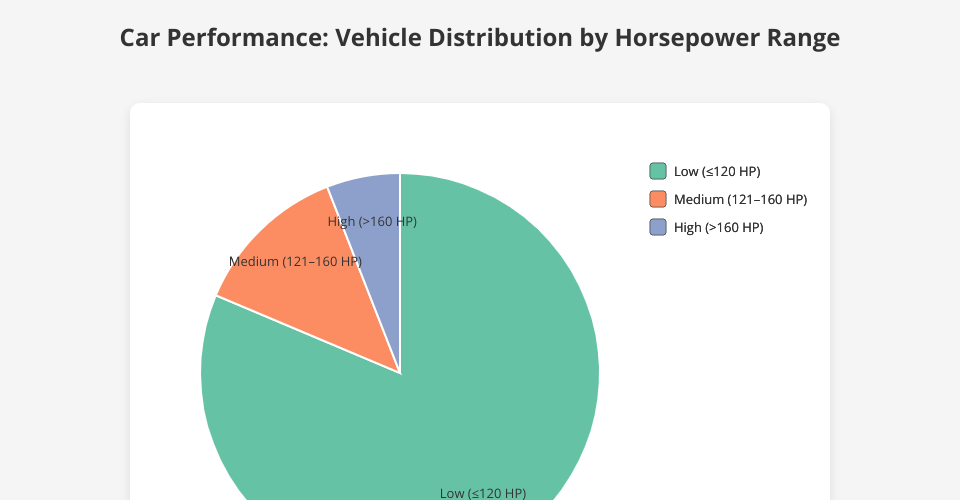
Output Preview
Pie chart showing:
- Low (≤120 HP)
- Medium (121–160 HP)
- High (>160 HP)
Legend is placed at the top-right corner for readability.
MIT Licensed