Resources
Contact
Pricing
🇺🇸
EN
Log in
Open Editor
Revision History
Export Image
Share
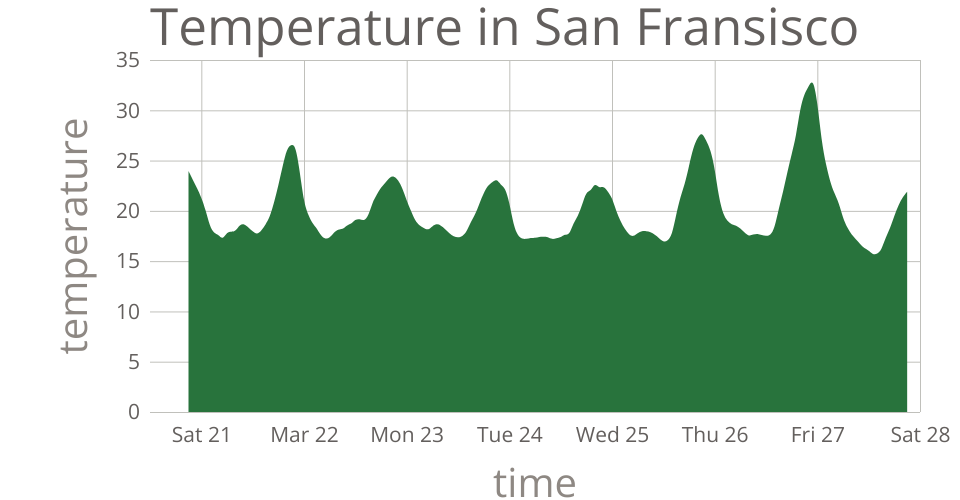
Line chart
1
Fork
0
Likes
soniyaa-dv
0 views in last 90 days
Last edited Jul 27, 2020
Created on Jul 27, 2020
Forked from
Scatter Plot with Menus
uses
v2 runtime
This scatter plot shows data about cars from
UCI Machine Learning Repositry: Auto MPG Data Set
MIT Licensed