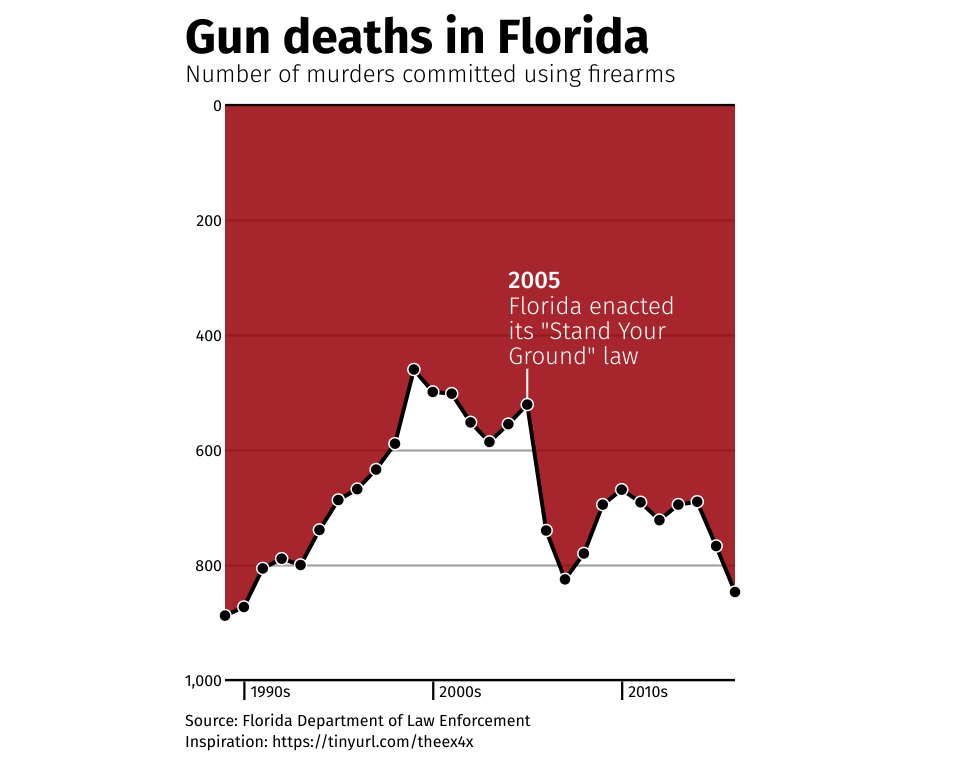
Florida Gun Deaths
This block provides a rough re-creation of the Florida Gun Deaths visualization. Keeping in mind the inspiration and issues discussed, try to redesign this visualization. Focus first on editing the style (colors, thickness of lines, etc.) before changing the encoding or visualization technique.
The goal of this exercise is to illustrate how small design choices can have a large impact on how we perceive the data, as well as how hard it is to come up with a visualization that is effective, accurate, and impactful.
Original Visualization
The original visualization appeared in the article This Chart Shows An Alarming Rise In Florida Gun Deaths After 'Stand Your Ground' Was Enacted article by Pamela Engel on Business Insider on February 18, 2014.
:warning: The author of the original chart is no longer on Twitter, so the following links no longer work. An archive of the original discussion can be found on the Wayback Machine for reference. They are kept here for reference:
The chart was created by Christine Chen. She responded to the discussion, and linked to her inspiration for the graphic.
The inspiration quoted appeared in the infographic Iraq's bloody toll by Simon Scarr on South China Morning Post on December 17, 2011.
Online Discussion
There was a lot of discussion, especially on Twitter and various blogs, when this visualization came out. Here are some of those posts:
Original Data
You can access the original (and updated) data for this visualization from the Florida Statistical Analysis Center. Specifically, you can download the "Murder: Firearm Type and Rate for Florida" dataset in PDF or Excel format the UCR Offense Data page.
Trifacta Recipe
To generate the data.csv file, the original 1971_fwd_murder_firearms.xlsx file was transformed using the following Trifacta Wrangler recipe:
header sourcerownumber: 3
delete row: IN($sourcerownumber, [1,2,4])
delete row: IN($sourcerownumber, [53, 54, 55, 56, 57, 58])
textformat col: Year type: removesymbols
replacemismatched col: Year~{Population % Change} type: Float with: null text: ''
derive type: single value: {Total by Firearm} / (Population / 100000) as: 'Murder by Firearm Rate per 100,000'