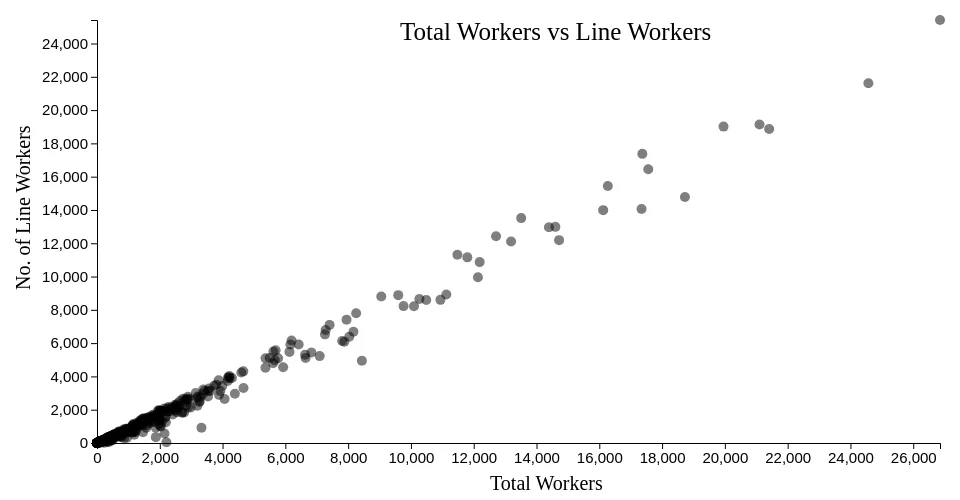
A scatter plot with D3
This visualization shows Nike Global Manufacturing Data Export. It visualizes the total number of workers vs the number of line workers across Nike manufacturing factories all over the world. Each circle represents a Nike manufacturing factory.
MIT Licensed