0 views in last 90 days
saivinay143
@saivinay143
Public vizzes

ICE 8 country map
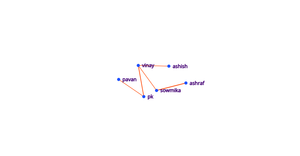
Fork of ICE-8: Social Network
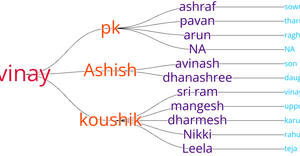
Fork of ICE 8 Family Tree
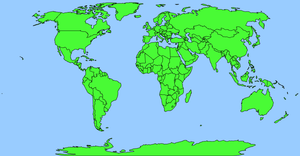
ICE 8 world map
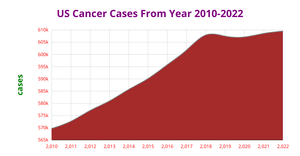
Fork of Fork of Fork of ICE 7 Area Chart
Fork of Area chart
Fork of Fork of Line Chart
Fork of Line Chart
Pie chart
Fork of Pie Chart
Fork of Fork of ICE 7 Line Chart
Fork of ICE 7 Line Chart

Fork of D3 line chart: Daily temperature in Belgium for 2021
Fork of Line Chart
Fork of Pie Chart
Fork of ICE - 7 Pie Chart Maanas Katta
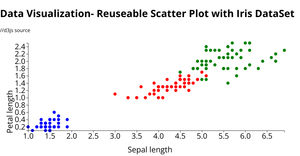
Fork of Data Visualization- Scatter Plot with Iris DataSet
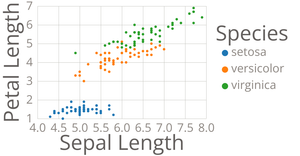
Fork of Stylized Scatter Plot with Color Legend

Fork of Car Sales Dateset

Fork of Fork of Scatter Plots
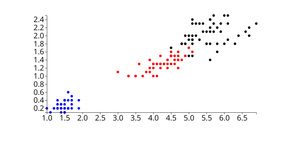
Fork of Iris Dataset Scatter Plot
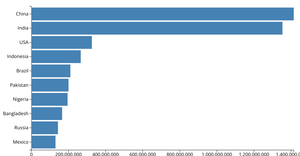
Fork of Let's make a Bar Graph with D3.js
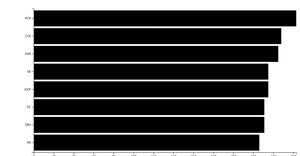
Fork of Let's make a Bar Graph with D3.js
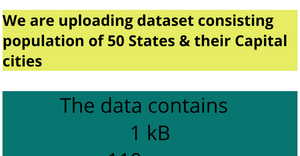
Fork of FICE-5: Loading and Parsing CSV Data with D3.js

Fork of Smiley Face Part III