Sales, Revenue & Profit Trends Visualization
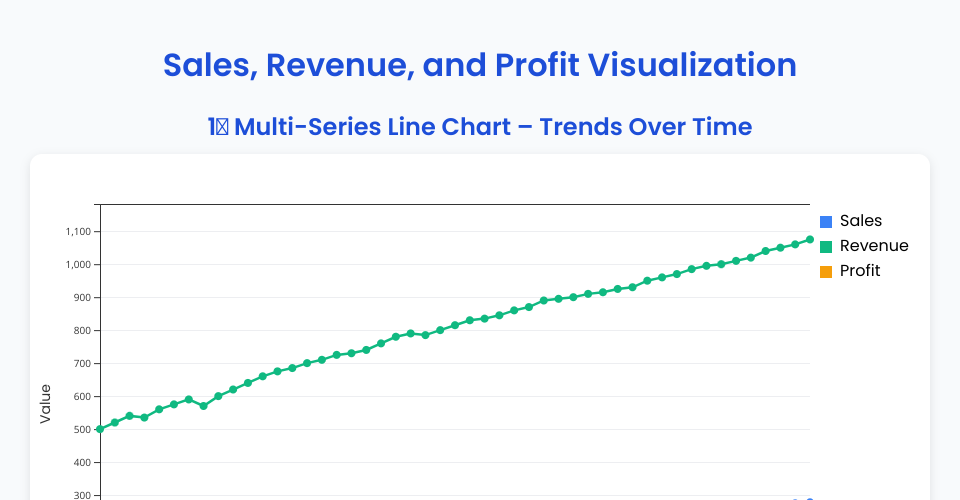
This project visualizes sales trends using D3.js with two interactive charts:
- Multi-series line chart showing Sales, Revenue, and Profit over time
- Combined bar and line chart showing Sales (bars) and Profit (line)
Features
- Interactive tooltips on data points
- Gridlines for better readability
- Custom color scheme
- Legend for data series identification
- Annotation marking peak profit point
- Responsive design with smooth transitions
Data
Data is sourced from trend.csv containing daily metrics
from January to February 2025.
Customization Elements
- Custom color palette for each metric
- Interactive hover effects on bars and data points
- Gridlines for better data reading
- Peak profit annotation with dashed line
- Tooltip functionality for detailed data inspection
- Custom font (Poppins) for improved typography
MIT Licensed