D3 Scatter Plot
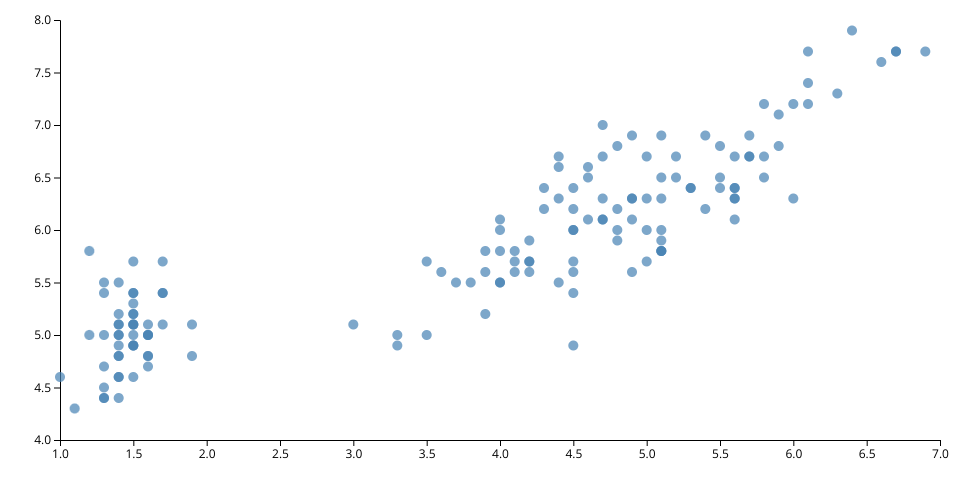
A reusable D3 scatter plot component built with the reusable chart pattern.
Features
- Reusable chart function following D3 conventions
- Configurable margins, dimensions, and data accessors
- Responsive to data updates
- Clean axis rendering
Data
Uses the Iris dataset from Curran's Gist repository.
Configuration
The chart can be configured using chainable methods:
.width(value)- Set chart width.height(value)- Set chart height.margin(object)- Set margins.xValue(function)- Set X-axis data accessor.yValue(function)- Set Y-axis data accessor
MIT Licensed