// ------------------------------ // SETUP SVG DIMENSIONS // ------------------------------ const margin = { top: 20, right: 30, bottom: 50, left: 60 }; const width = 800 - margin.left - margin.right; const height = 500 - margin.top - margin.bottom;
// Select SVG and append group element const svg =
d3.select("#chart") .append("g") .attr("transform",
translate(${margin.left}, ${margin.top}));
// ------------------------------ // LOAD CSV DATA //
d3.csv("website_traffic.csv").then(data => {
// Convert string values to numbers
data.forEach(d => {
d.Day = +d.Day;
d.Visits = +d.Visits;
});
// ------------------------------
// CREATE SCALES
// ------------------------------
// X scale (Day)
const x = d3.scaleLinear()
.domain(d3.extent(data, d => d.Day))
.range([0, width]);
// Y scale (Visits)
const y = d3.scaleLinear()
.domain([0, d3.max(data, d => d.Visits)])
.range([height, 0]);
// ------------------------------
// ADD AXES
// ------------------------------
// X Axis
svg.append("g")
.attr("transform", `translate(0, ${height})`)
.call(d3.axisBottom(x));
// Y Axis
svg.append("g")
.call(d3.axisLeft(y));
// ------------------------------
// ADD AXIS LABELS
// ------------------------------
// X-axis label
svg.append("text")
.attr("class", "axis-label")
.attr("x", width / 2)
.attr("y", height + 40)
.attr("text-anchor", "middle")
.text("Day");
// Y-axis label
svg.append("text")
.attr("class", "axis-label")
.attr("transform", "rotate(-90)")
.attr("x", -height / 2)
.attr("y", -45)
.attr("text-anchor", "middle")
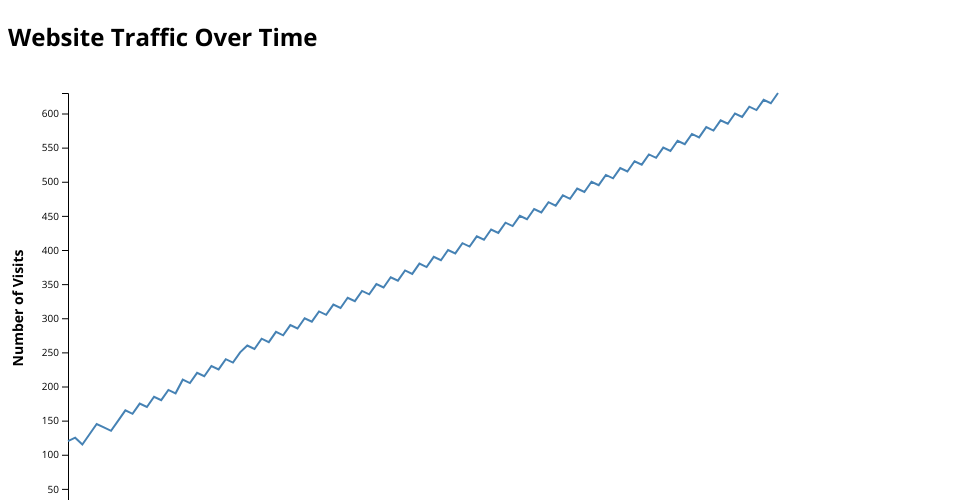
.text("Number of Visits");
// ------------------------------
// CREATE LINE GENERATOR
// ------------------------------
const line = d3.line()
.x(d => x(d.Day))
.y(d => y(d.Visits));
// ------------------------------
// DRAW LINE CHART
// ------------------------------
svg.append("path")
.datum(data)
.attr("class", "line")
.attr("d", line);
});
MIT Licensed