Global Renewable Energy Production Visualization
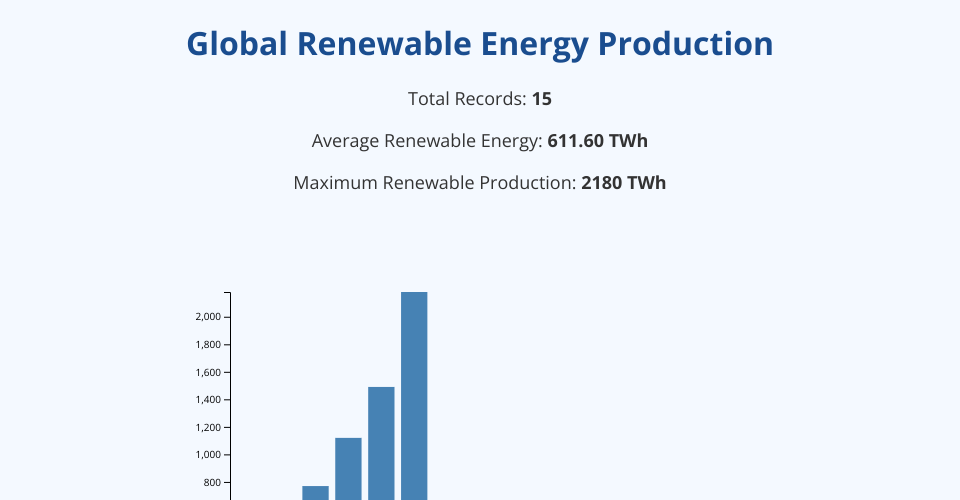
A D3.js data visualization project displaying renewable energy production statistics by country and year.
Features
- Interactive bar chart visualization
- Data summary with total records, average, and maximum renewable energy production
- Hover effects on bars for better interactivity
- Responsive design
Technologies
- D3.js v7.3.0
- HTML5
- CSS3
Author
Created by Md Saiful Islam for CSCE 5320 - ICE 5
MIT Licensed