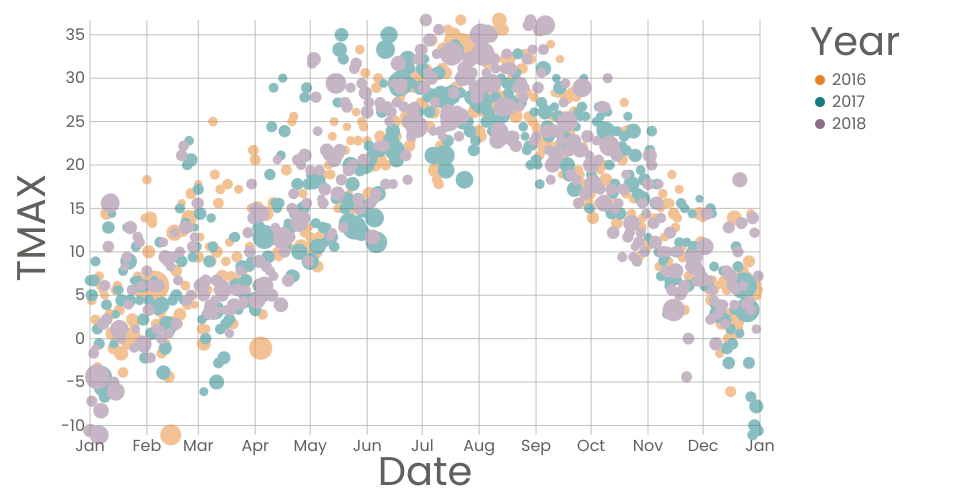
A scatter plot of Logan Airport Weather 2016-2018.
The size of point indicate the average delay of flights on this date.
Issues:
- It looks kind of messy because of too many points.
- When the legend is hovered, the points are highlighted, but meanwhile I cannot hover the points to check to tooltips.
- Points of 2018 are always most clear because they are on the top.
MIT Licensed