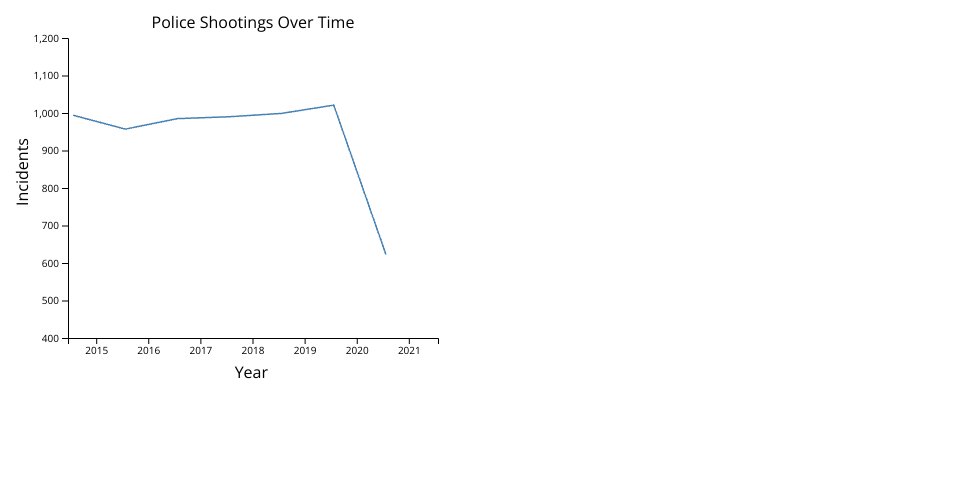
A line chart displaying the number of police shootings from 2015 to mid-2020.
The x axis represents the years, and the y axis represents the number of incidents (shootings) that occurred.
MIT Licensed
A line chart displaying the number of police shootings from 2015 to mid-2020.
The x axis represents the years, and the y axis represents the number of incidents (shootings) that occurred.