A visualization constructed using D3 and (https://github.com/vega/vega-lite-api/).
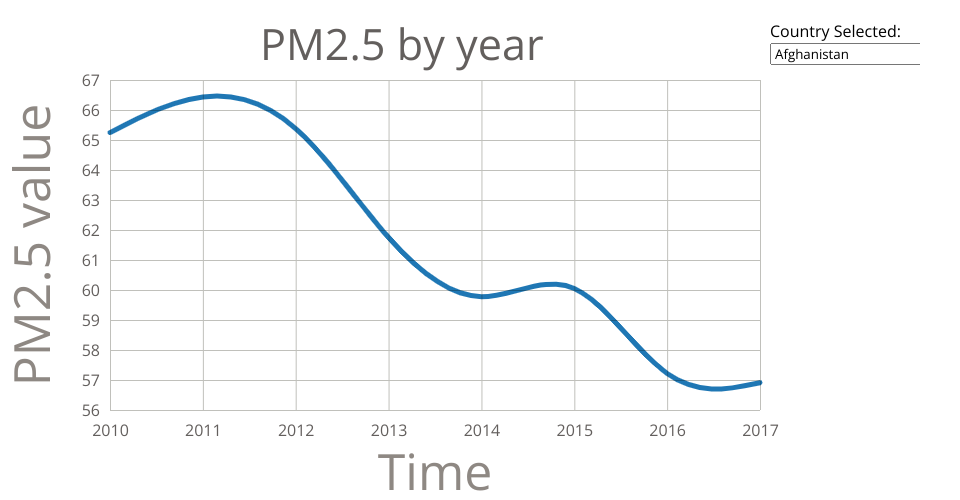
The data shown here comes from the Kaggle:PM2.5 Global Air Pollution 2010-2017 (Mean Annual Exposure for 240 Countries) via Gist: PM2.5 Global Air Pollution Dataset (From 2010-2017)
The data is processed and melt to fit the visualization. It realize the sketch of showing PM2.5 trend in a specific country (eg. China).
The user can choose the country by using the menu and to see the trend from 2010 to 2017 in this country.
The only bug in this visualization is that I don't know why the little arrow of the menu disappear...
MIT Licensed