A visualization constructed using the vega-lite-api.
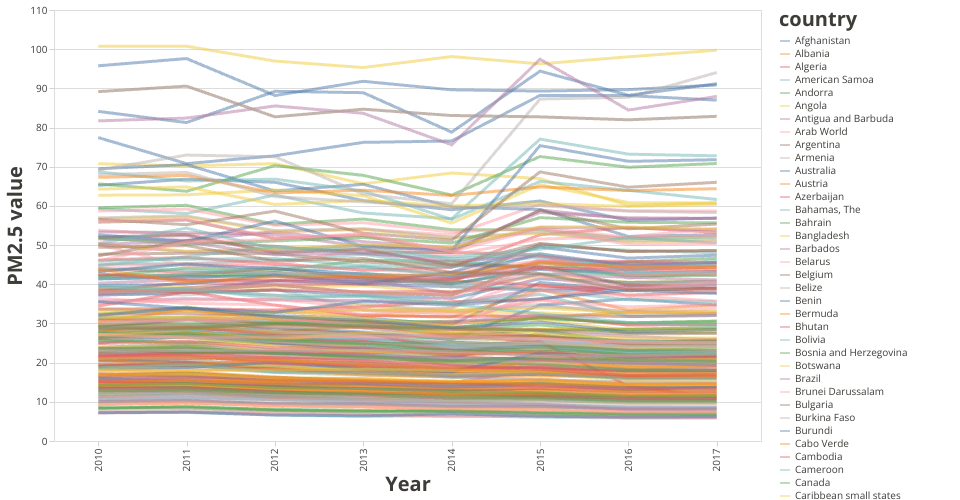
The data shown here comes from the Kaggle:PM2.5 Global Air Pollution 2010-2017 (Mean Annual Exposure for 240 Countries) via Gist: PM2.5 Global Air Pollution Dataset (From 2010-2017)
The data is processed and melt to fit the visualization.
So, based on this visualization we can know the trend of PM2.5 Air pollution from 2010 to 2017. We can know that in 2014 there would be a sharp decrease in PM2.5 for most country. But in 2015 the value increases. From the news we can find that there was some policy change in WHO and each country which may have effect on the PM2.5 level in some degree.
MIT Licensed