A visualization constructed using D3.
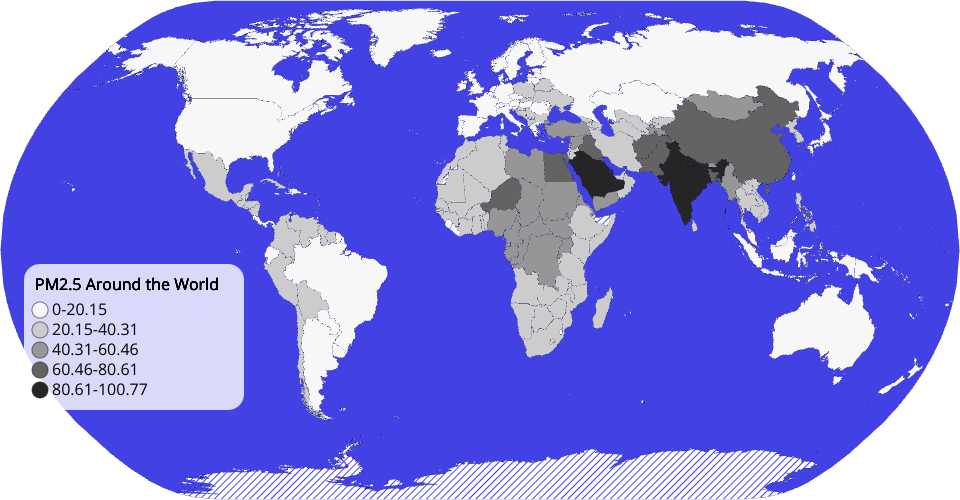
The data shown here comes from the Kaggle:PM2.5 Global Air Pollution 2010-2017 (Mean Annual Exposure for 240 Countries) via Gist: PM2.5 Global Air Pollution Dataset (From 2010-2017)
The data is processed and melt to fit the visualization. It realize a Choropleth Map of the world to show the PM2.5 value in a specific year and the distribution around the world.
MIT Licensed