A visualization constructed using the vega-lite-api.
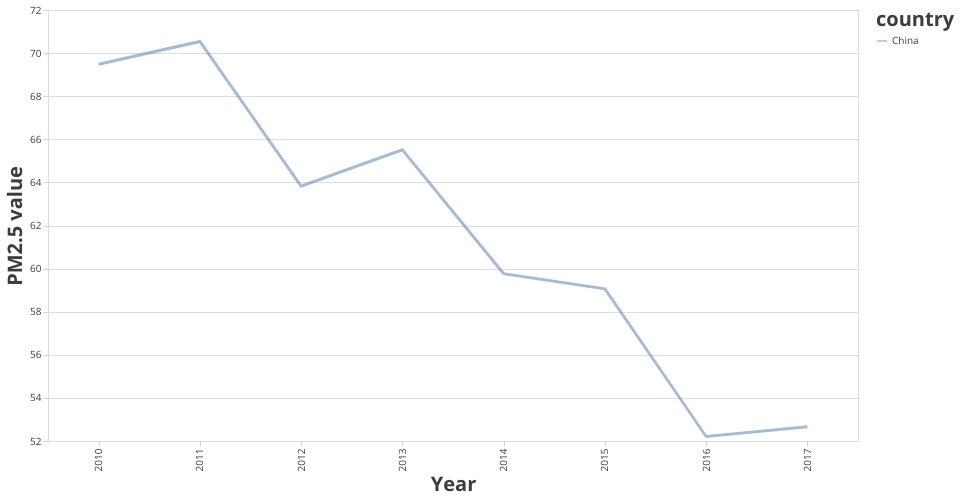
The data shown here comes from the Kaggle:PM2.5 Global Air Pollution 2010-2017 (Mean Annual Exposure for 240 Countries) via Gist: PM2.5 Global Air Pollution Dataset (From 2010-2017)
The data is processed and melt to fit the visualization. It realize the sketch of showing PM2.5 trend in a specific country (eg. China).
There are some problems where I would do some further studies. I want to make a combobox to let the user select the country they want to see. However, I cannot get the parameter out of the eventlistener which is monitoring the selected option in the combobox. How to pass the selected option in the combobox into the data loading session. There is such thing in Java Jframe called getselecteditem. but how to do this in js?
I have modified the getData.js to try to fix this problem but I failed. And in the index.html, there is a select box which is commented out. Please help me with this problem.