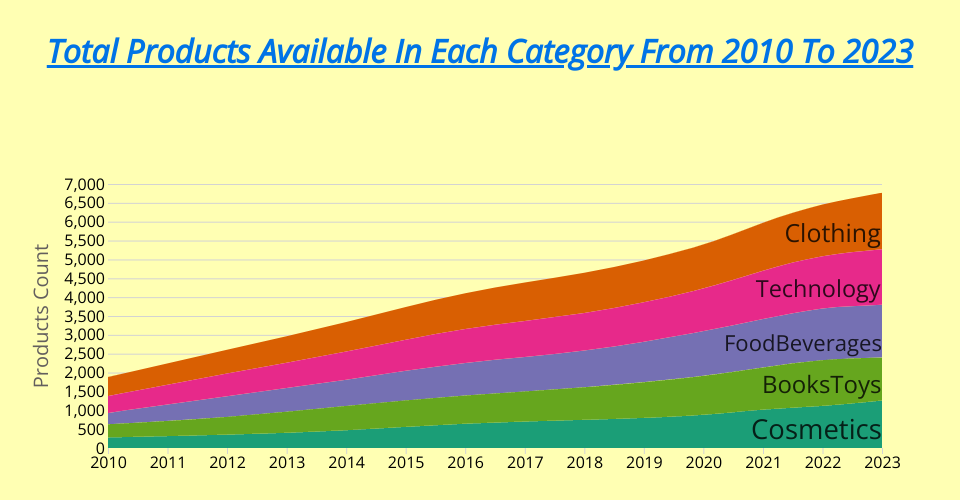
A stacked area chart of Global CO2 Emissions.
The segments "Solids", "Liquids", and "Gas" are the forms of fossil fuels being burned.
Uses d3-area-label to position labels.
Inspired by Scott Judson’s Block: Global Carbon Emissions Area Chart.
MIT Licensed