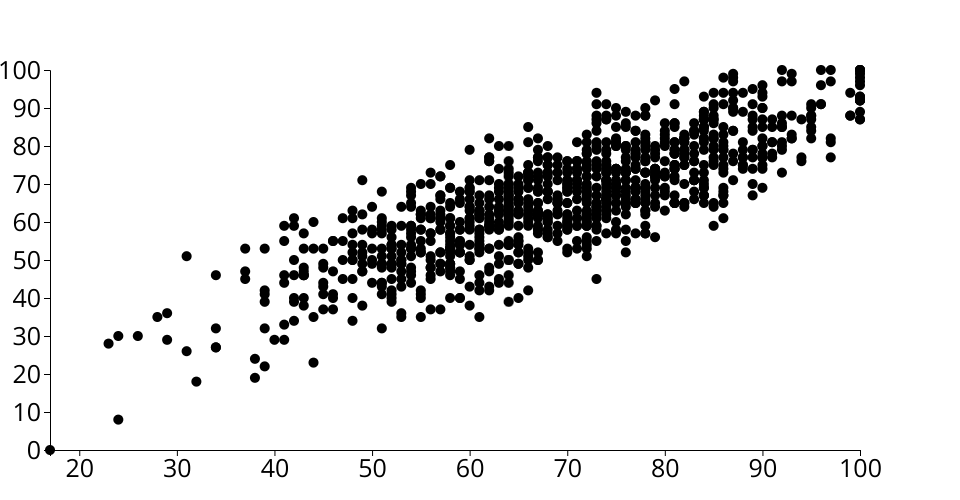
This visualization is a D3 scatterplot of reading vs. math test performance scores from the Student Test Performance dataset.
MIT Licensed
This visualization is a D3 scatterplot of reading vs. math test performance scores from the Student Test Performance dataset.