This chart was made using Female v. Military as a base and modified based on CS573 Week 4 videos. New data was then ported from the International Cabinets dataset - modified to only include a count of the number of countries with no females in the cabinet each year.
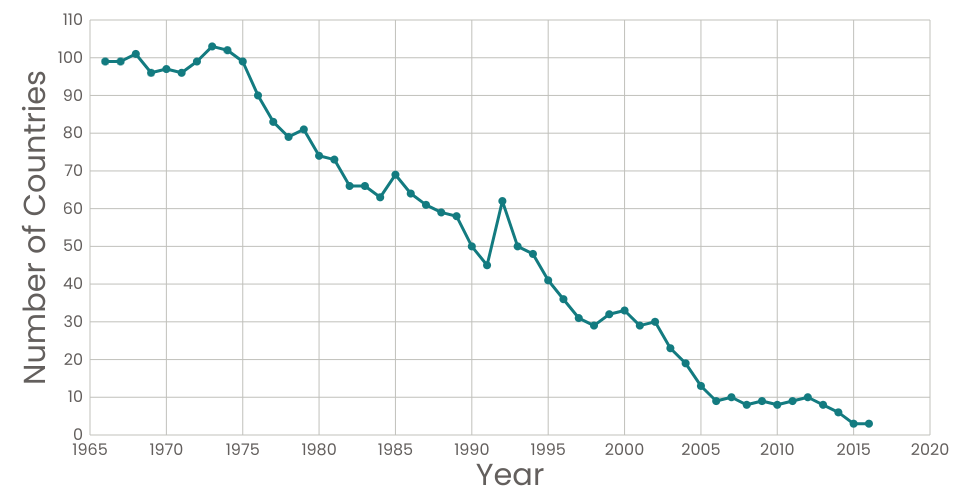
The chart plots the number of countries with no females in the cabinet plotted over time. As seen in the plot, there did not seem to be much change between 1965 and 1975. After 1975 there was a steady decline in the number of countries with no women in the cabinet until about 2005. From 2006 onward, there have been 10 or fewer countries each year with zero women in the cabinet.
The data is derived from WhoGov's International Cabinets dataset. The dataset contains information about more than 50,000 cabinet members from 177 countries, spanning July 1966 - July 2016. There is a separate entry for each cabinet member, from each country, for each year. Each entry contains information such as party affiliation, gender, age and military affiliation. This chart was made using this chart as a base and modified based on CS573 Week 5 videos.