Unlocking Observable Plot with VizHub's hot reloading patterns!
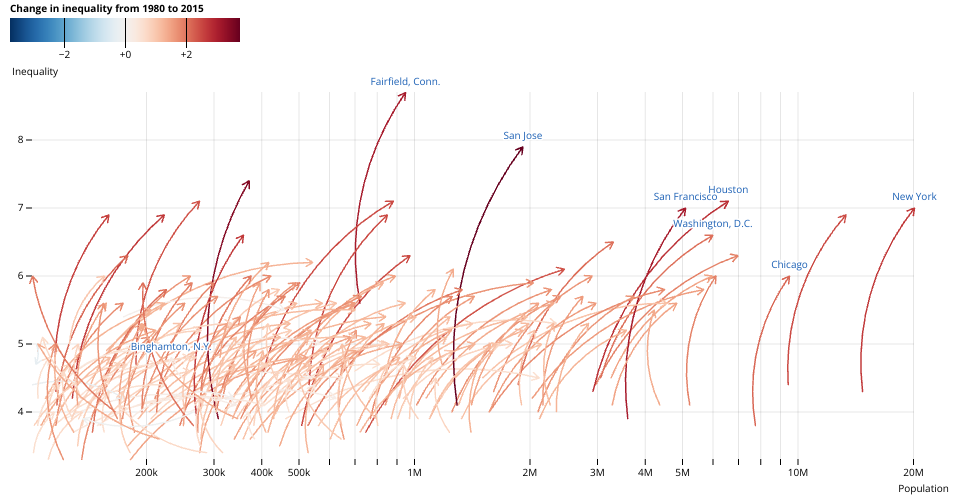
This example was ported from Observable: Arrow variation chart.
A few modifications were made to make it work outside of Observable:
- In
styles.csswe set the margin of<figure>to 0, because without doing that the user agent stylesheet sets some strange margins. - The margins are specified for the plot, and the
insetwas removed. - The margins are specified for the legend, otherwise the legend is flush to the upper left corner.
- The
widthandheightare set based on the measured container, so it should be possible to change the size of the container and have the chart update properly.
Thanks to Stefan Apostol for the original HTML port (which this is forked from) and the inspiration to make this happen!
MIT Licensed