Version 6 of final draft
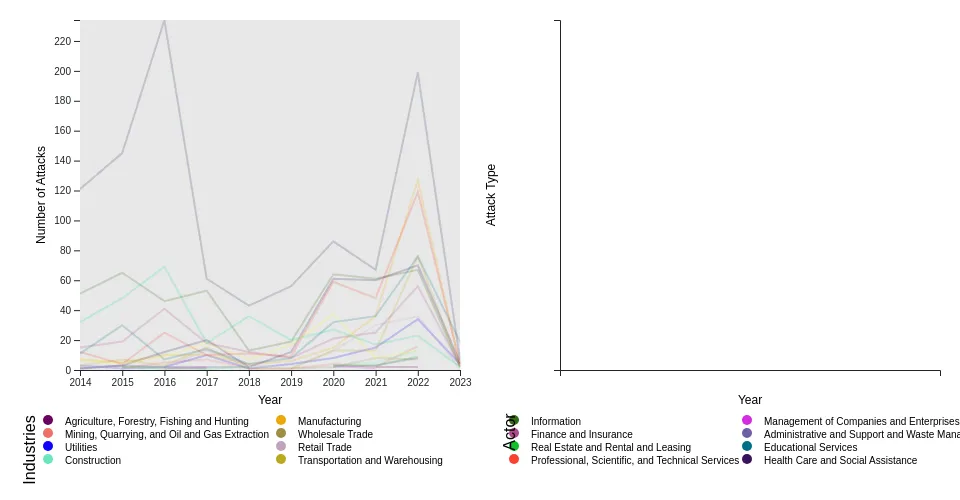
Shows two viz's presenting cyber attack data from 2014 to 2023
Left Viz shows the number of attacks against various industries over time.
Right Viz shows the types of attacks executed by various actors against a selected industry (from the left viz).
Updates from version 5
-Added highlighting of hovered data in color legend as well as line plots. -Added custom cool scheme to handle twenty different datapoints. Previous version had repeating colors.
Future work: -possibly change right viz to a weighted circles to show when multiple same datapoints exist. -fix brushing in right viz to highligh actors when selecting over multiple attack types.
MIT Licensed