Global AI Content Impact Dataset (Kaggle)
Source: Kaggle – Global AI Content Impact Dataset
URL: https://www.kaggle.com/datasets/...global-ai-content-impact-dataset
(searchable on Kaggle) :contentReference[oaicite:5]{index=5}
Description
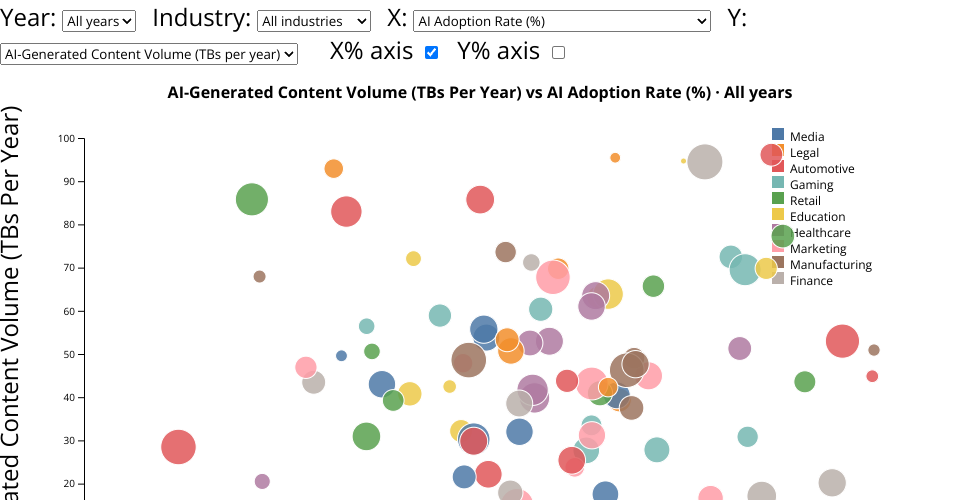
This multidimensional dataset offers insights into AI adoption and its broader implications on the labor market. It includes metrics such as job displacement estimates, shifts in revenue, levels of human–AI collaboration, consumer sentiment, and market share changes. It’s ideal for visualizing and analyzing patterns related to workforce disruption in different contexts.
Attributes (VAD Framework)
| Attribute | Type | Notes |
|---|---|---|
Country |
Categorical | Example: United States, UK, Germany |
Year |
Time | Year of measurement (e.g., 2020, 2021, 2022) |
AI Adoption Rate |
Quantitative | Share or percentage of organizations using AI |
Job Displacement Rate |
Quantitative | Estimated percentage of jobs lost due to AI |
Revenue Growth (%) |
Quantitative | Revenue change associated with AI implementation |
Human-AI Collaboration |
Quantitative | Metric showing barriers vs. synergy between AI and human workers |
Consumer Trust |
Quantitative | Survey-based trust scores toward AI-powered services |
Market Share Change |
Quantitative | Change in companies’ market share post-AI adoption |
Industry |
Categorical | Sector related to the data (e.g., Manufacturing, Retail) |
Why it Works
- Directly tackles the automation/labor displacement theme.
- Rich, multidimensional data allows you to explore causal or correlational patterns (e.g., AI adoption vs job displacement).
- Suits visualization: scatter plots, line trends by country/industry, bubble charts illustrating multi-variable relationships, etc.
Parsing Notes
- Ensure percentages (like displacement rate or adoption) are parsed as numbers, potentially divided by 100 if exported as whole numbers.
Yearshould be treated as Time for line or trend visualizations.Industryis useful for grouping or faceting your charts.
MIT Licensed