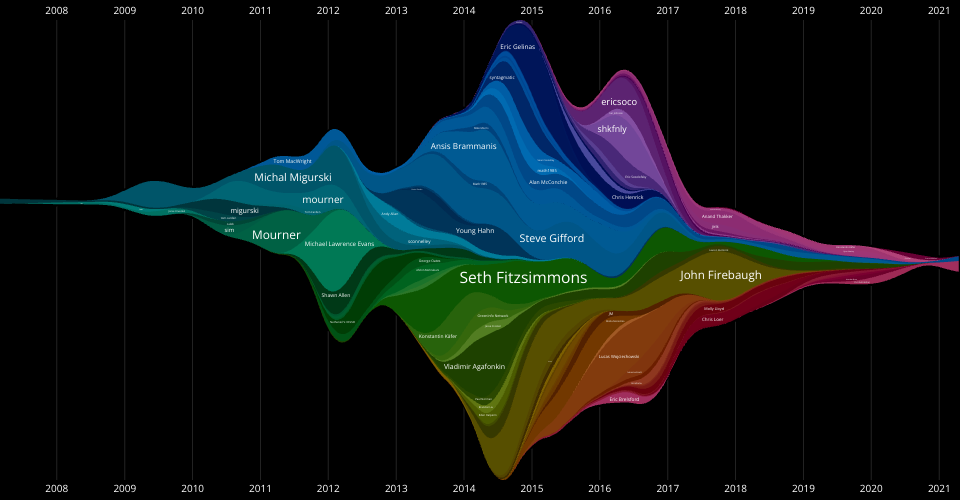
This is an experiment in visualizing Stamen's Open Source activity over the years. Each layer is one of the top 100 contributors (by commit count) in a Stamen Open Source repository. The thickness of each layer is the number of commits per week with smoothing applied. This visualization uses a modified Streamgraph technique where the layer order is determined by the time of the first commit. So, as you read the labels from bottom to top, that corresponds to the history of when each repository was introduced.
ISC Licensed