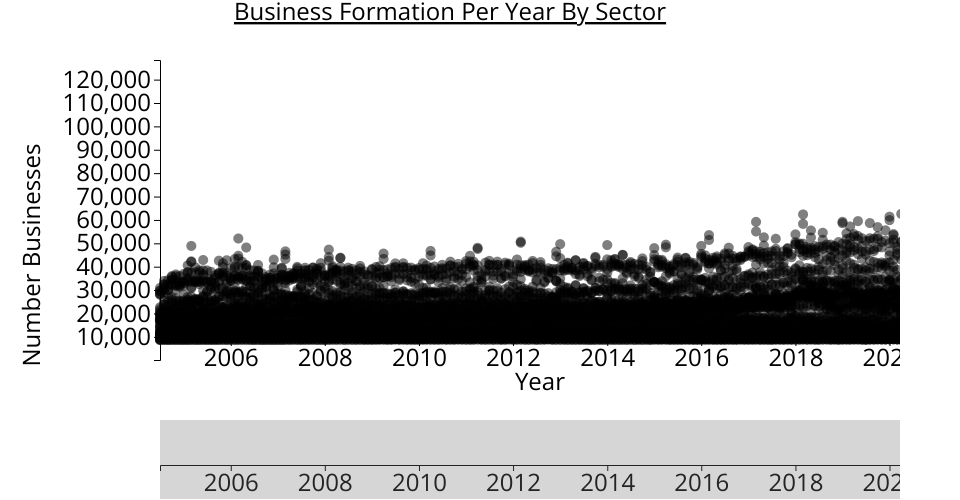
A visualization of the data US Business Formation. The scatterplot shows the number of business formed in the US by sector highlighting manufacturing sector in red by year.
Another interesting example https://bl.ocks.org/cmgiven/abca90f6ba5f0a14c54d1eb952f8949c
MIT Licensed