A visualization constructed using the vega-lite-api.
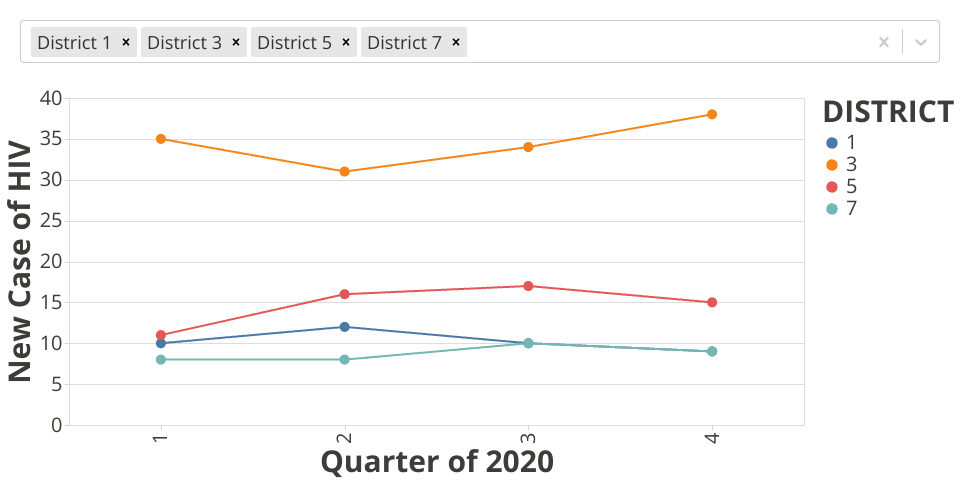
The data shown here comes from the Bangkok Smart Monitoring System. The line charts represents the number of new HIV cases aggregated by district (in Bangkok).
Using the react-select as the option menu to allow user to select which districts to show the result.
MIT Licensed