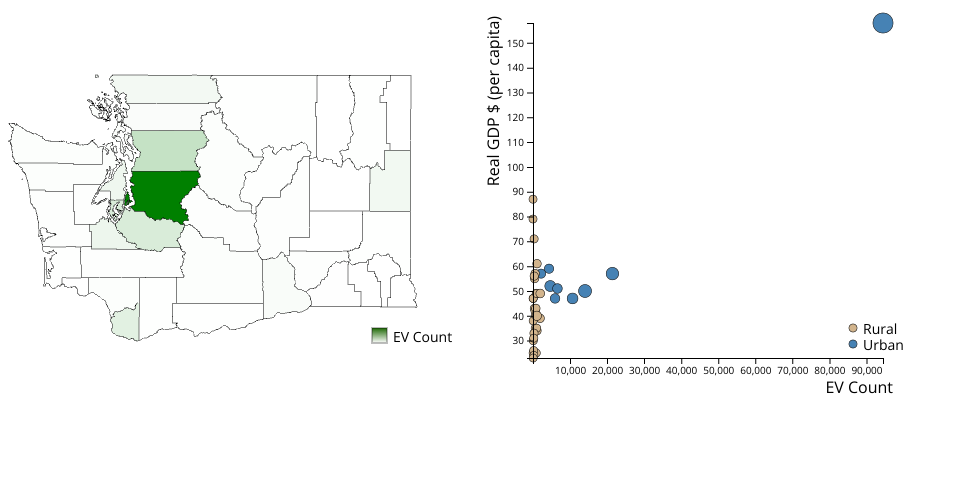
Viz: A scatter plot of EV Count ~ RGDP per capita in WA State by county. Each point is sized by population and colored by county type (rural or urban). The plot is linked to a map of WA State wth a gradient by EV Count.
Task: What is the distribution of EVs by county in WA? Why do some counties have more/less EVs than others?
Features: Hover over points/counties for details. Click + drag on the plot to zoom in and double-click to reset.
MIT Licensed