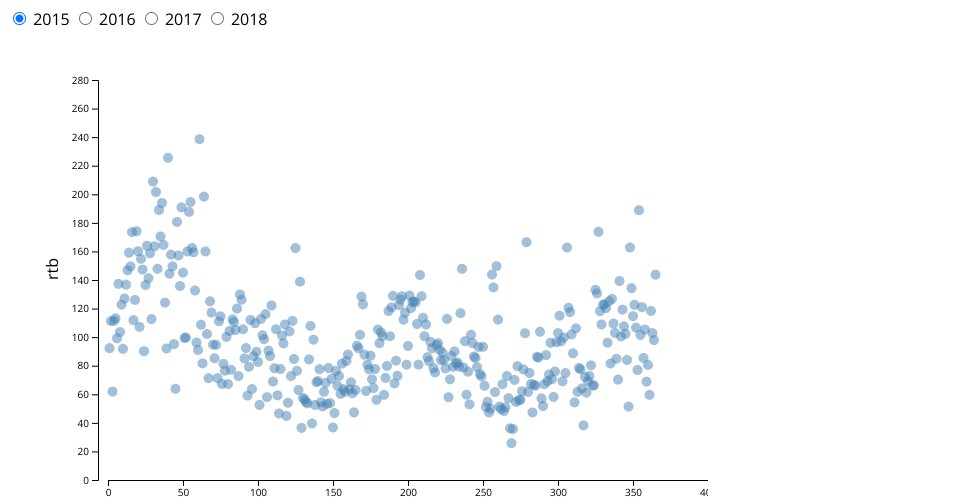
A scatter plot showing rtb values for each day in the years 2015-2018
AND
a line plot comparing the weather on a selected day with the average weather for that month across the entire dataset.
Links:
MIT Licensed
A scatter plot showing rtb values for each day in the years 2015-2018
AND
a line plot comparing the weather on a selected day with the average weather for that month across the entire dataset.
Links: