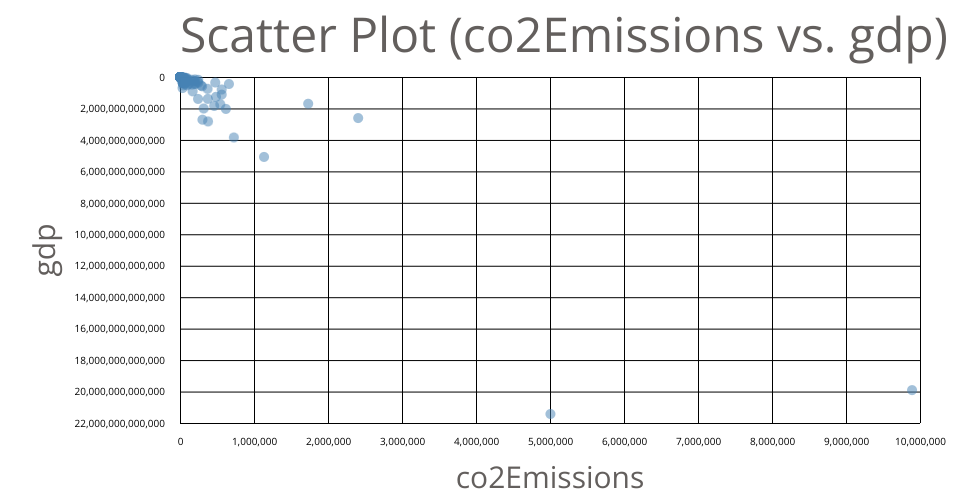
This scatter plot compares Co2 emissions and GDP for 190+ countries. The data comes from this table. It also demonstrates customization of D3 axes.
MIT Licensed
This scatter plot compares Co2 emissions and GDP for 190+ countries. The data comes from this table. It also demonstrates customization of D3 axes.