AWS S3 Static Website Hosting Visualization
This project demonstrates a comprehensive data visualization using React and D3.js. It provides an interactive overview of AWS S3 Static Website Hosting setup.
Features
- Interactive tabs for exploring different aspects of S3 website hosting
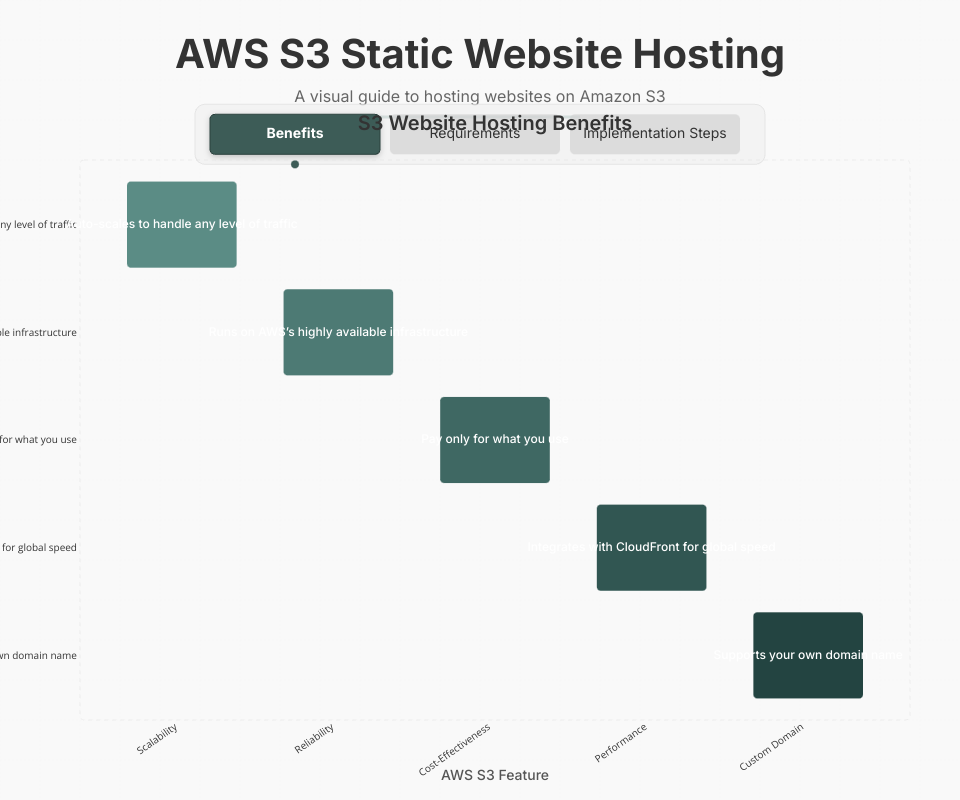
- Bar chart visualization of S3 website hosting benefits with tooltips
- Table view of hosting requirements with interactive hover effects
- Step-by-step implementation diagram with animated transitions
- Clean, modern visual design with consistent color scheme
- Responsive layout that adapts to different screen sizes
- Smooth animations and transitions for better user experience
- Loading states and error handling
Technologies Used
- React 19.1.0
- D3.js 7.8.5
- Modern JavaScript (ES Modules)
- CSS for styling
- Inter font family for typography
Project Structure
- app.jsx: Main React component with loading/error states
- main.js: Entry point for D3 visualization with background grid
- renderSVG.js: Creates/updates the SVG container
- renderTitle.js: Renders the chart title and subtitle
- renderTabs.js: Handles the tab navigation with animations
- renderContent.js: Main content container logic with transitions
- renderBarChart.js: Handles benefits visualization with interactive tooltips
- renderTable.js: Renders requirements table with row animations
- renderStepsDiagram.js: Creates step-by-step diagram with animated arrows
- tooltip.js: Provides tooltip functionality for enhanced interaction
- loadData.js: Loads and processes CSV data with error handling
- useDimensions.js: Custom hook for responsive sizing
Getting Started
- Clone this repository
- Open the project folder
- Serve the files with a local server (e.g.,
npx serve) - Open the local URL in your browser
Interaction
Click on the tabs to navigate between different views:
- Benefits: Explore the advantages of S3 static website hosting with interactive bars
- Requirements: View what you need to get started with detailed tooltips
- Implementation Steps: Follow a step-by-step guide with animated transitions
Data Format
The visualization uses three CSV files:
- data1.csv: S3 hosting benefits
- data2.csv: Requirements for setup
- data3.csv: Implementation steps
Accessibility
The visualization includes:
- Semantic HTML structure
- Color contrast for readability
- Interactive elements with hover states
- Responsive design for various screen sizes
MIT Licensed