Baseball Hitting Metrics Dashboard
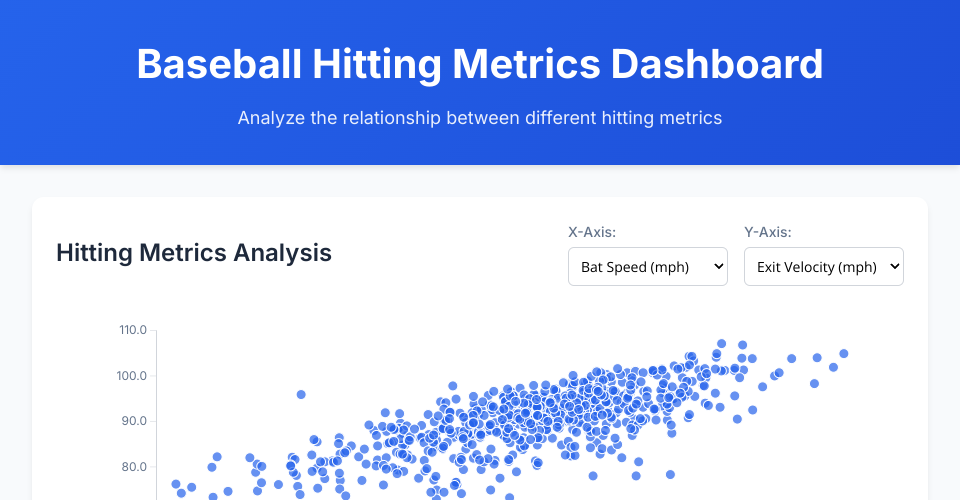
An interactive data visualization dashboard for analyzing baseball hitting metrics using React and D3.js. This application allows users to explore relationships between different hitting performance metrics through interactive scatter plots.
Features
- Interactive scatter plot visualization
- Real-time metric selection for X and Y axes
- Responsive design that adapts to different screen sizes
- Hover tooltips showing detailed data points
- Smooth animations and transitions
- Clean, modern UI design
How It's Made
Tech Stack
- React 19 - Frontend framework for building the user interface
- D3.js v7 - Data visualization library for creating interactive charts
- Modern JavaScript (ES6+) - Using ES modules and modern syntax
- CSS3 - Custom styling with responsive design
- HTML5 - Semantic markup structure
Architecture
The application follows a modular React component architecture with custom hooks for data management and D3 integration:
MIT Licensed
Comments
The animation is sweet on this one!
FT