AI Platforms Comparison Interactive Dashboard
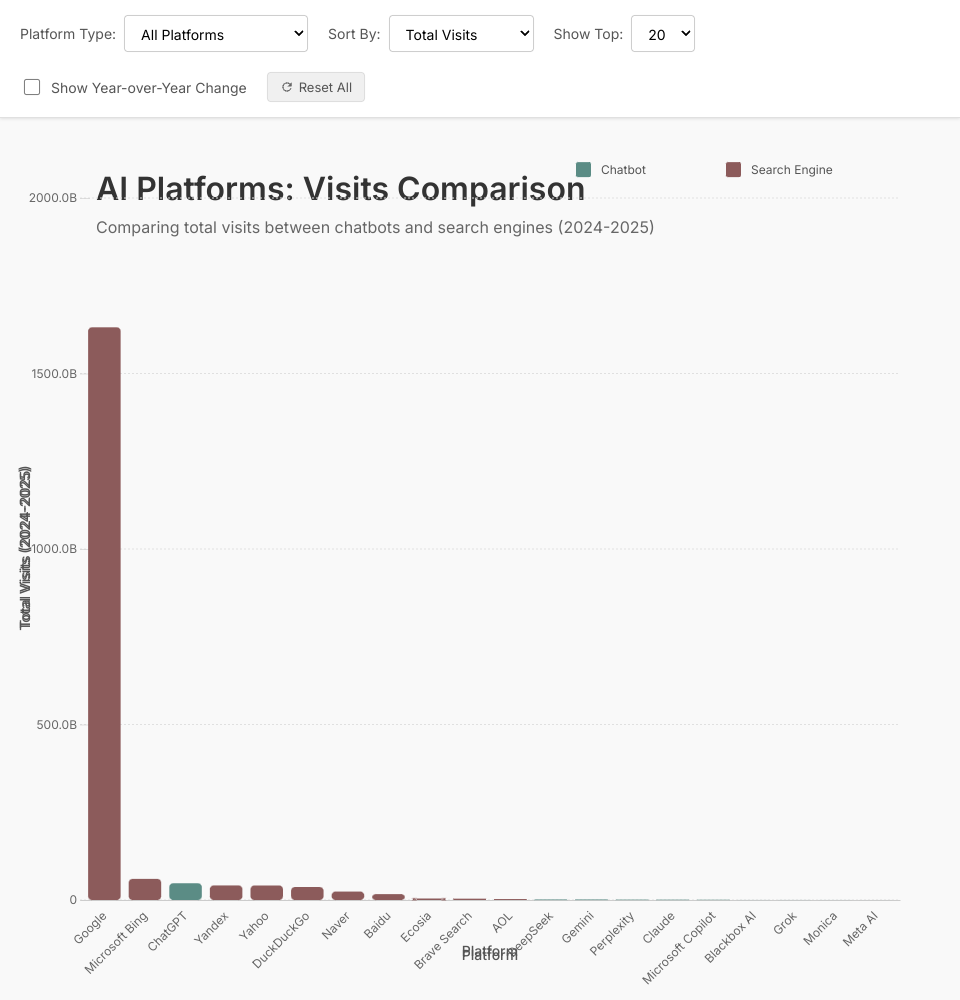
This visualization is an interactive dashboard comparing total visits of various AI platforms, including both chatbots and search engines, for the period of April 2024 to March 2025.
Features:
- Interactive bar chart comparing total visits
- Color-coding to distinguish between chatbots and search engines
- Tooltips showing additional information like year-over-year change
- Filter by platform type (Chatbots or Search Engines)
- Sort by visits, YoY change percentage, or platform name
- Limit number of platforms displayed
- Option to show year-over-year change visualization
- Animated transitions between different views
- Interactive platform selection for focus
- Reset button to clear all filters and selections
Data Source:
The data includes traffic statistics for major AI platforms including ChatGPT, Google, Bing, and others.
Dashboard Controls:
- Platform Type Filter: Show all platforms, chatbots only, or search engines only
- Sort By: Sort platforms by total visits, YoY change percentage, or name
- Show Top: Limit the number of displayed platforms to 5, 10, or 20
- Year-over-Year Change: Toggle visualization of YoY growth/decline
- Reset All: Button to reset all filters and selections to default values
Visualization Elements:
- Color-coded bars represent different platform types
- Bar height represents total visits
- YoY indicators show change from previous year
- Grid lines help with value comparison
- Hover effects for improved user interaction
- Responsive design adapts to different screen sizes
MIT Licensed