United States Home Prices Map
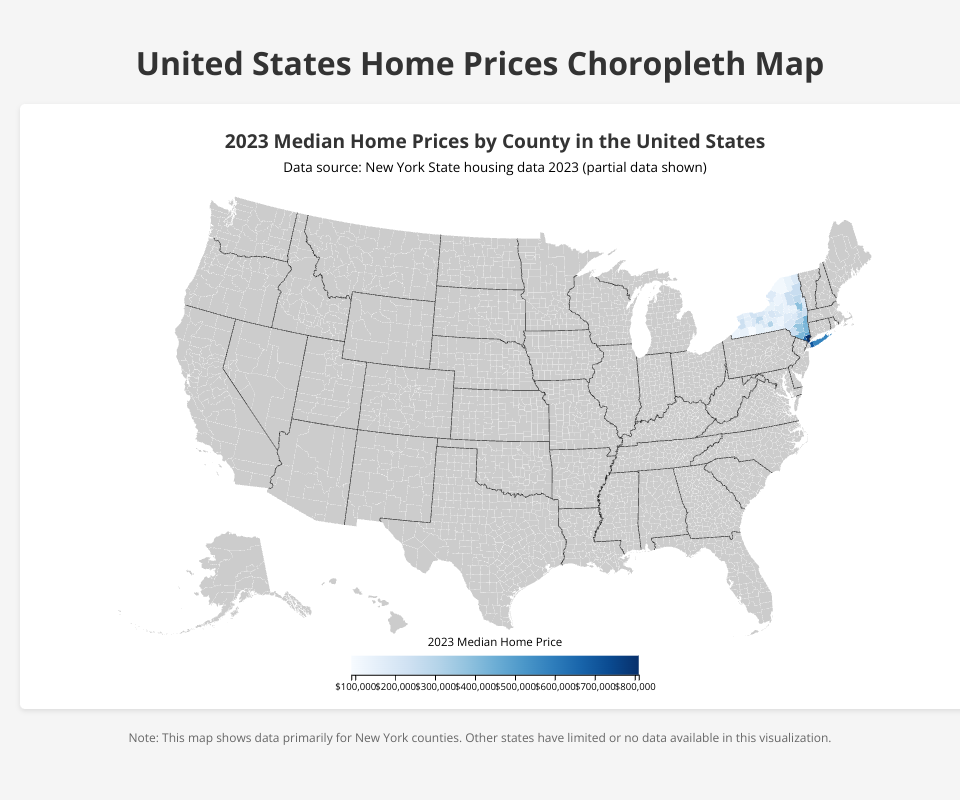
This visualization shows a choropleth map of median home prices across the United States, with a focus on New York State counties where data is available.
Features
- Interactive map showing county-level median home prices for 2023
- Color gradient indicating price ranges
- Hover tooltips showing detailed county information
- Responsive design that works on various screen sizes
Data Source
The visualization uses housing data from New York State for 2023, including:
- Median home prices by county
- Number of sales by county
Technical Implementation
The visualization is built using:
- D3.js v7 for data visualization
- TopoJSON for geographic data processing
- HTML/CSS for layout and styling
Usage
Simply open the index.html file in a modern web browser to view the visualization.
MIT Licensed