New York State Home Sales Data Visualization
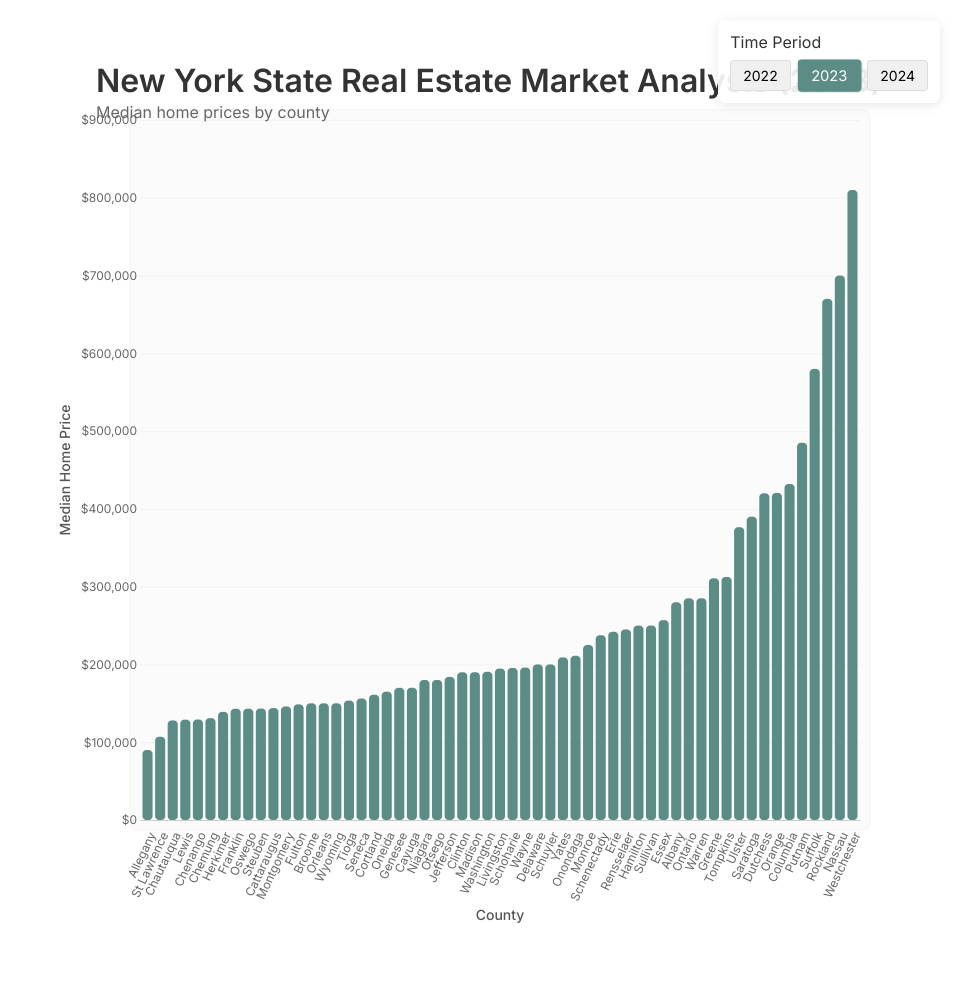
This interactive visualization displays median home prices across counties in New York State. Built with React and D3.js, it allows users to explore housing data from 2022 to 2024.
Features
- Interactive bar chart showing median home prices by county
- Year selector to switch between 2022, 2023, and 2024 data
- Interactive tooltips with historical price trends
- Responsive design that adapts to different screen sizes
- Animated transitions between data views
How to Use
- Select a year using the time period controls in the top-right
- Hover over any county bar to see detailed information
- Click on a county to highlight it and dim other counties
Technologies Used
- React for UI components and state management
- D3.js for data visualization and animations
- CSS for styling and responsive design
MIT Licensed