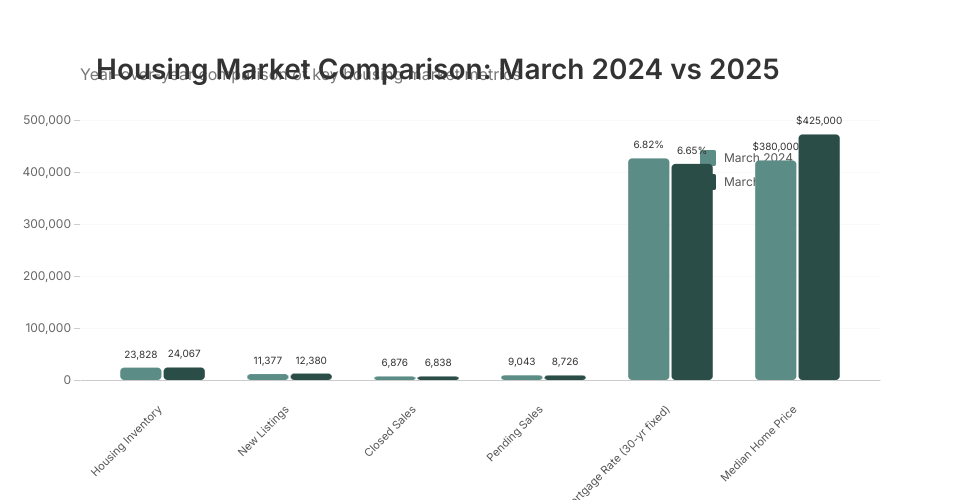
Housing Market Comparison Visualization
This visualization compares key housing market metrics between March 2024 and March 2025, showing:
- Housing Inventory
- New Listings
- Closed Sales
- Pending Sales
- Average Mortgage Rate (30-yr fixed)
- Median Home Price
The chart displays both the absolute values and the percentage change for each metric.
MIT Licensed