Earth Rotation Visualization
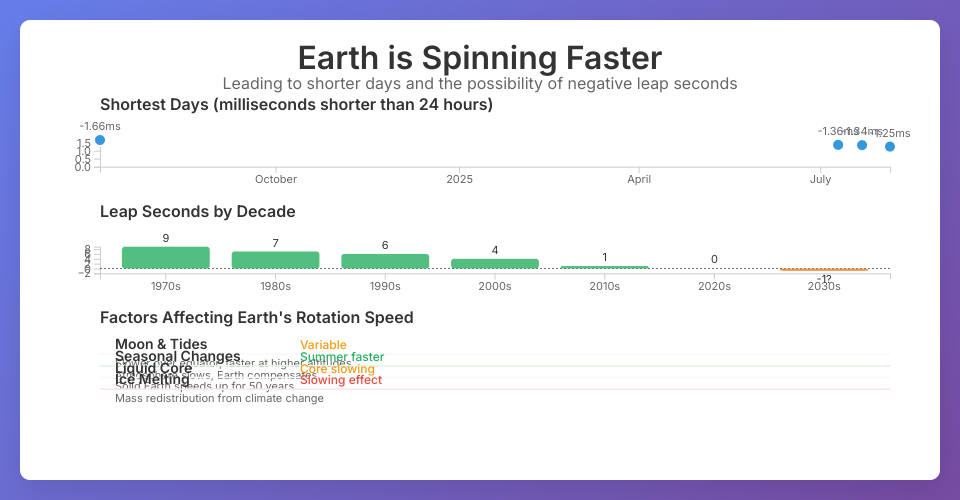
An interactive data visualization showing how Earth's rotation is accelerating, leading to shorter days and the potential for negative leap seconds.
Overview
This visualization presents three interconnected charts that illustrate the changing nature of Earth's rotation:
- Shortest Days Chart - Shows record-breaking short days measured in milliseconds shorter than 24 hours
- Leap Seconds by Decade - Displays the historical trend of leap seconds and predictions for future negative leap seconds
- Rotation Factors - Explains the various natural phenomena affecting Earth's rotation speed
Features
- Interactive data points and bars with hover effects
- Click interactions to select and highlight specific data points
- Responsive design that adapts to different screen sizes
- Clean, modern interface with smooth animations
- Real-time data updates based on recent astronomical measurements
Technology Stack
- React 19 - Modern UI framework with hooks
- D3.js v7 - Data visualization and DOM manipulation
- ES6 Modules - Modern JavaScript module system
- CSS3 - Styling with gradients, transitions, and responsive design
Project Structure
MIT Licensed